Pipeline Reliability Report
Azure DevOps has Test Analytics for one pipeline at a time. The question is across pipelines: which of our build pipelines is least reliable, and what are the top failing tests across all of them? This tool walks runs across every pipeline in your project and produces a single HTML report — per-pipeline failure rate + avg duration, top 10 failing tests, top 10 flaky tests — the cross-pipeline rollup Test Analytics doesn't ship.
Test Analytics is single-pipeline. Reliability is a portfolio question.
Single-pipeline view, multi-pipeline reality.
Eng managers run 3-10 pipelines. The triage question across them is "which one is broken, and what tests are failing most." Test Analytics answers per-pipeline; the cross-pipeline answer requires running the dashboard 10 times. Microsoft's own pipeline-health docs name the three core reliability metrics:
"The three primary metrics to understand pipeline reliability, speed, and stability are: Failure Rate (percentage of runs that fail), Duration (total time from commit to deployment), and Flaky Tests (tests with intermittent pass/fail results)." Microsoft Learn · Discovering Pipeline Health
The metrics are documented. The cross-pipeline rollup is missing.
A test that fails 1 in 10 runs trains the team to ignore failures.
ADO marks tests as flaky when they pass on retry within the same run. The data is there. The cross-pipeline ranking ("test_radio_handoff fails 50% of the time and we just re-run it") isn't surfaced. This tool ranks the top 10 flaky tests across pipelines so the highest-leverage fixes land first.
One page. Per-pipeline table. Top failing + flaky tests across all.
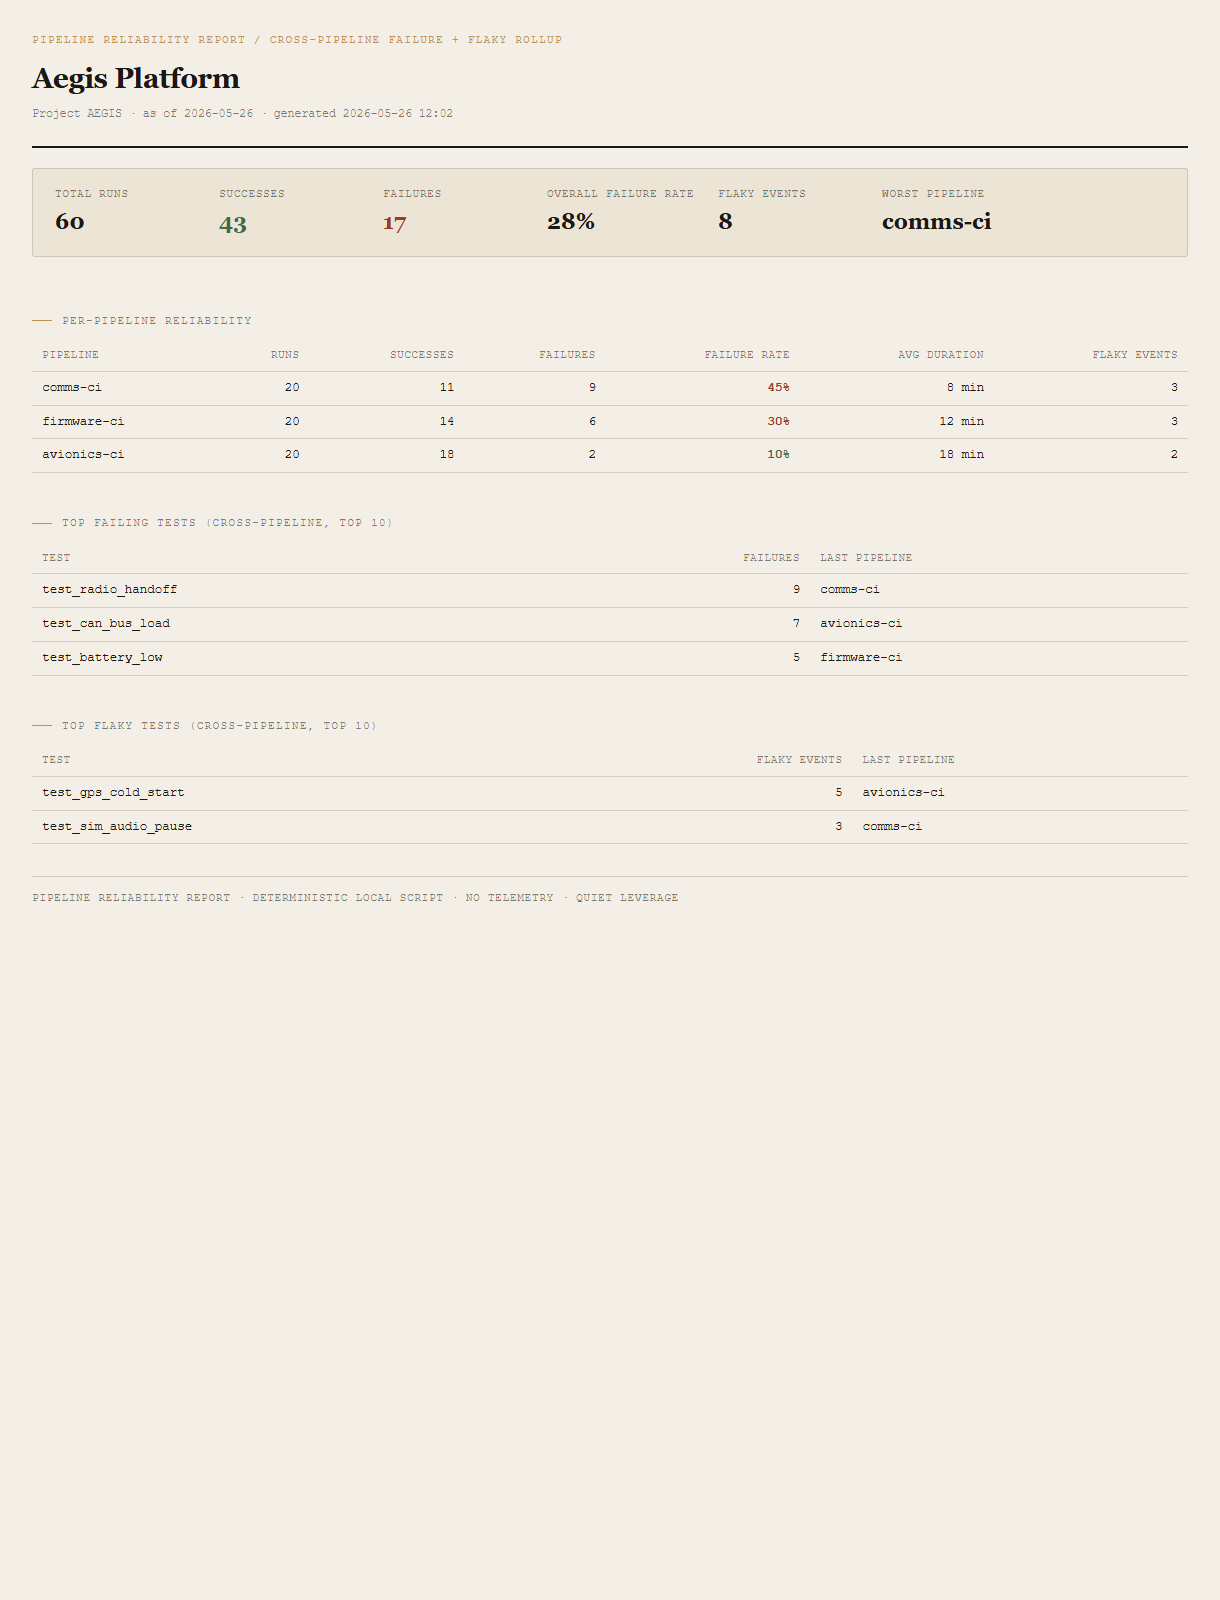
Summary header
Total runs, success/fail counts, overall failure rate, total flaky events, worst pipeline named explicitly.
Per-pipeline reliability table
One row per pipeline. Runs, successes, failures, failure rate %, avg duration in minutes, flaky events. Sorted by failure rate descending so the worst lands at the top. Failure rates >= 30% in red, 15-29% amber, < 15% green.
Top failing tests (cross-pipeline)
Top 10 tests by failure count across every pipeline in the report. Each shows failure count and the most recent pipeline that ran it.
Top flaky tests (cross-pipeline)
Top 10 tests by flaky-event count. A flaky event is a test that failed initially but passed on rerun within the same run -- ADO's own marker.
Requirements
- OSWindows, macOS, or Linux
- RuntimePowerShell 7+ (
pwsh). 5.1 is not supported. - BrowserAnything modern. UI on
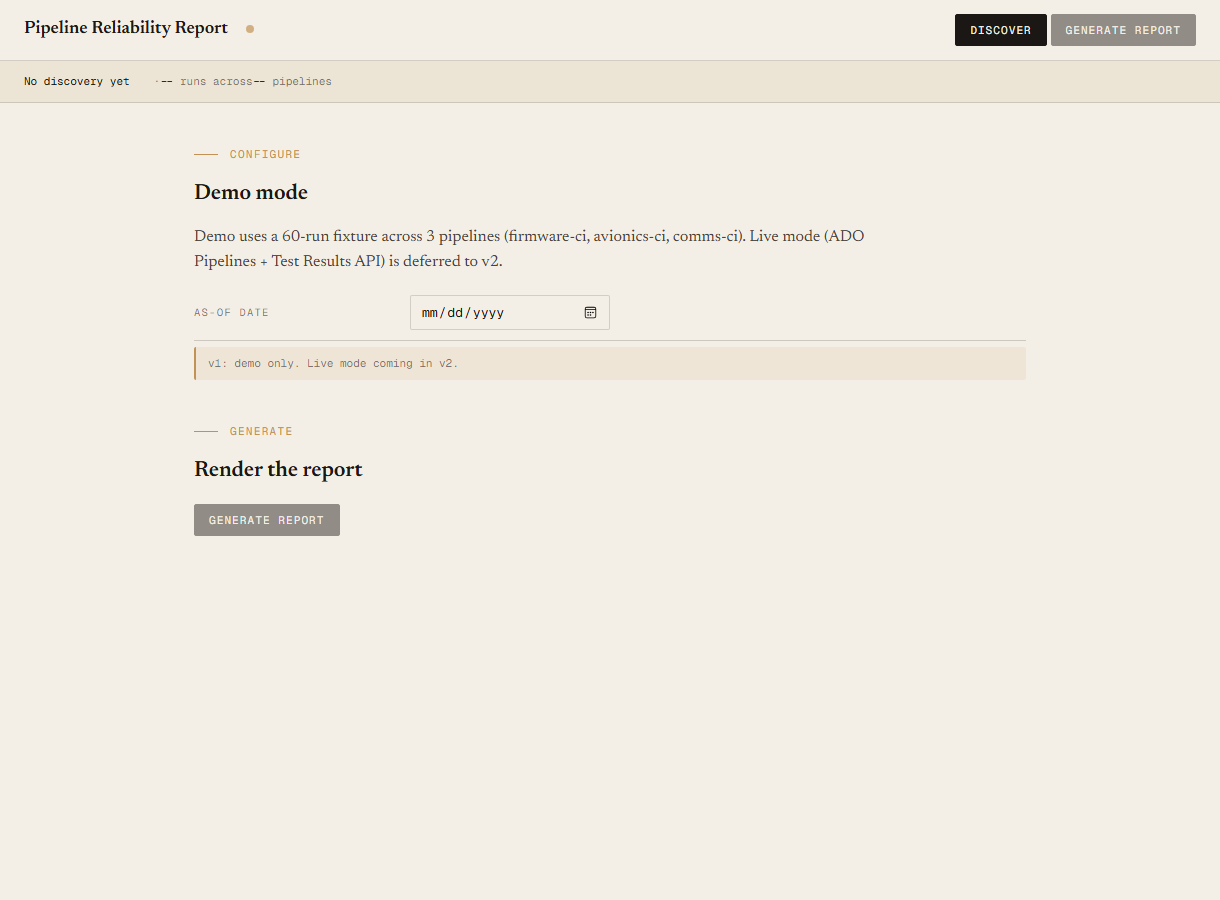
localhost:8780. - Azure DevOpsLive mode deferred to v2. v1 demonstrates the report shape on a bundled fixture.
- Demo modeBundled 60-run / 3-pipeline Aegis Platform fixture -- runs end-to-end with no creds.
Claude could write this. Two reasons to prefer the script.
Some workplaces — defense, medical devices, finance, anywhere with a strict IT policy — won't let Claude or any AI tool touch production data. These tools run on your machine, with no Claude or AI in the data path. Vendor data (in this case, your Azure DevOps organization's pipeline runs and test results) flows direct from your machine to dev.azure.com and back — no third-party SaaS in between, no telemetry, no tokens leaving your environment. And even where AI is allowed, repeat workflows shouldn't cost tokens — a deterministic script runs the same way every time, for free, forever. The prompt guide below shows how this tool was built with Claude; the download is what you run after.
Three files. Free.
The tool, a user guide, and a prompt guide showing the spec, the fixture engineering, and the Pester contract.
Drop your email to unlock the downloads.
One email when new tools ship, digest only. Confirms via Kit (double opt-in). No tracking. Unlocks every download on the site from this browser.
./start.ps1.