Sprint Report Builder
A self-contained tool that produces a single-page sprint report from your Azure DevOps iteration data. Burn-up chart with goal and plan lines, configurable work-item table, runs entirely on your machine. No data leaves your laptop.
The built-in reports never quite say what you need them to.
Azure DevOps ships burn-down charts and velocity reports out of the box. They're fine. They show the shape of the sprint. They don't show your shape: the goal you committed to, the plan as scope shifted, the items closed by your team versus the items that quietly slid in mid-sprint.
Most teams react by exporting work-item lists into a spreadsheet and gluing them into a status doc by hand. That's repetitive and easy to drift. This tool replaces that step with a generated HTML report you can open in a browser, print, or paste into an email.
One page. Burn-up plus a table.
The report has two sections: a burn-up chart and a work-item table. That's it. KPI tiles, velocity charts, and burn-down lines are all deliberately excluded — burn-up encodes the same information more honestly (scope and progress on separate axes), and velocity is a different report (cross-sprint, not single-sprint).
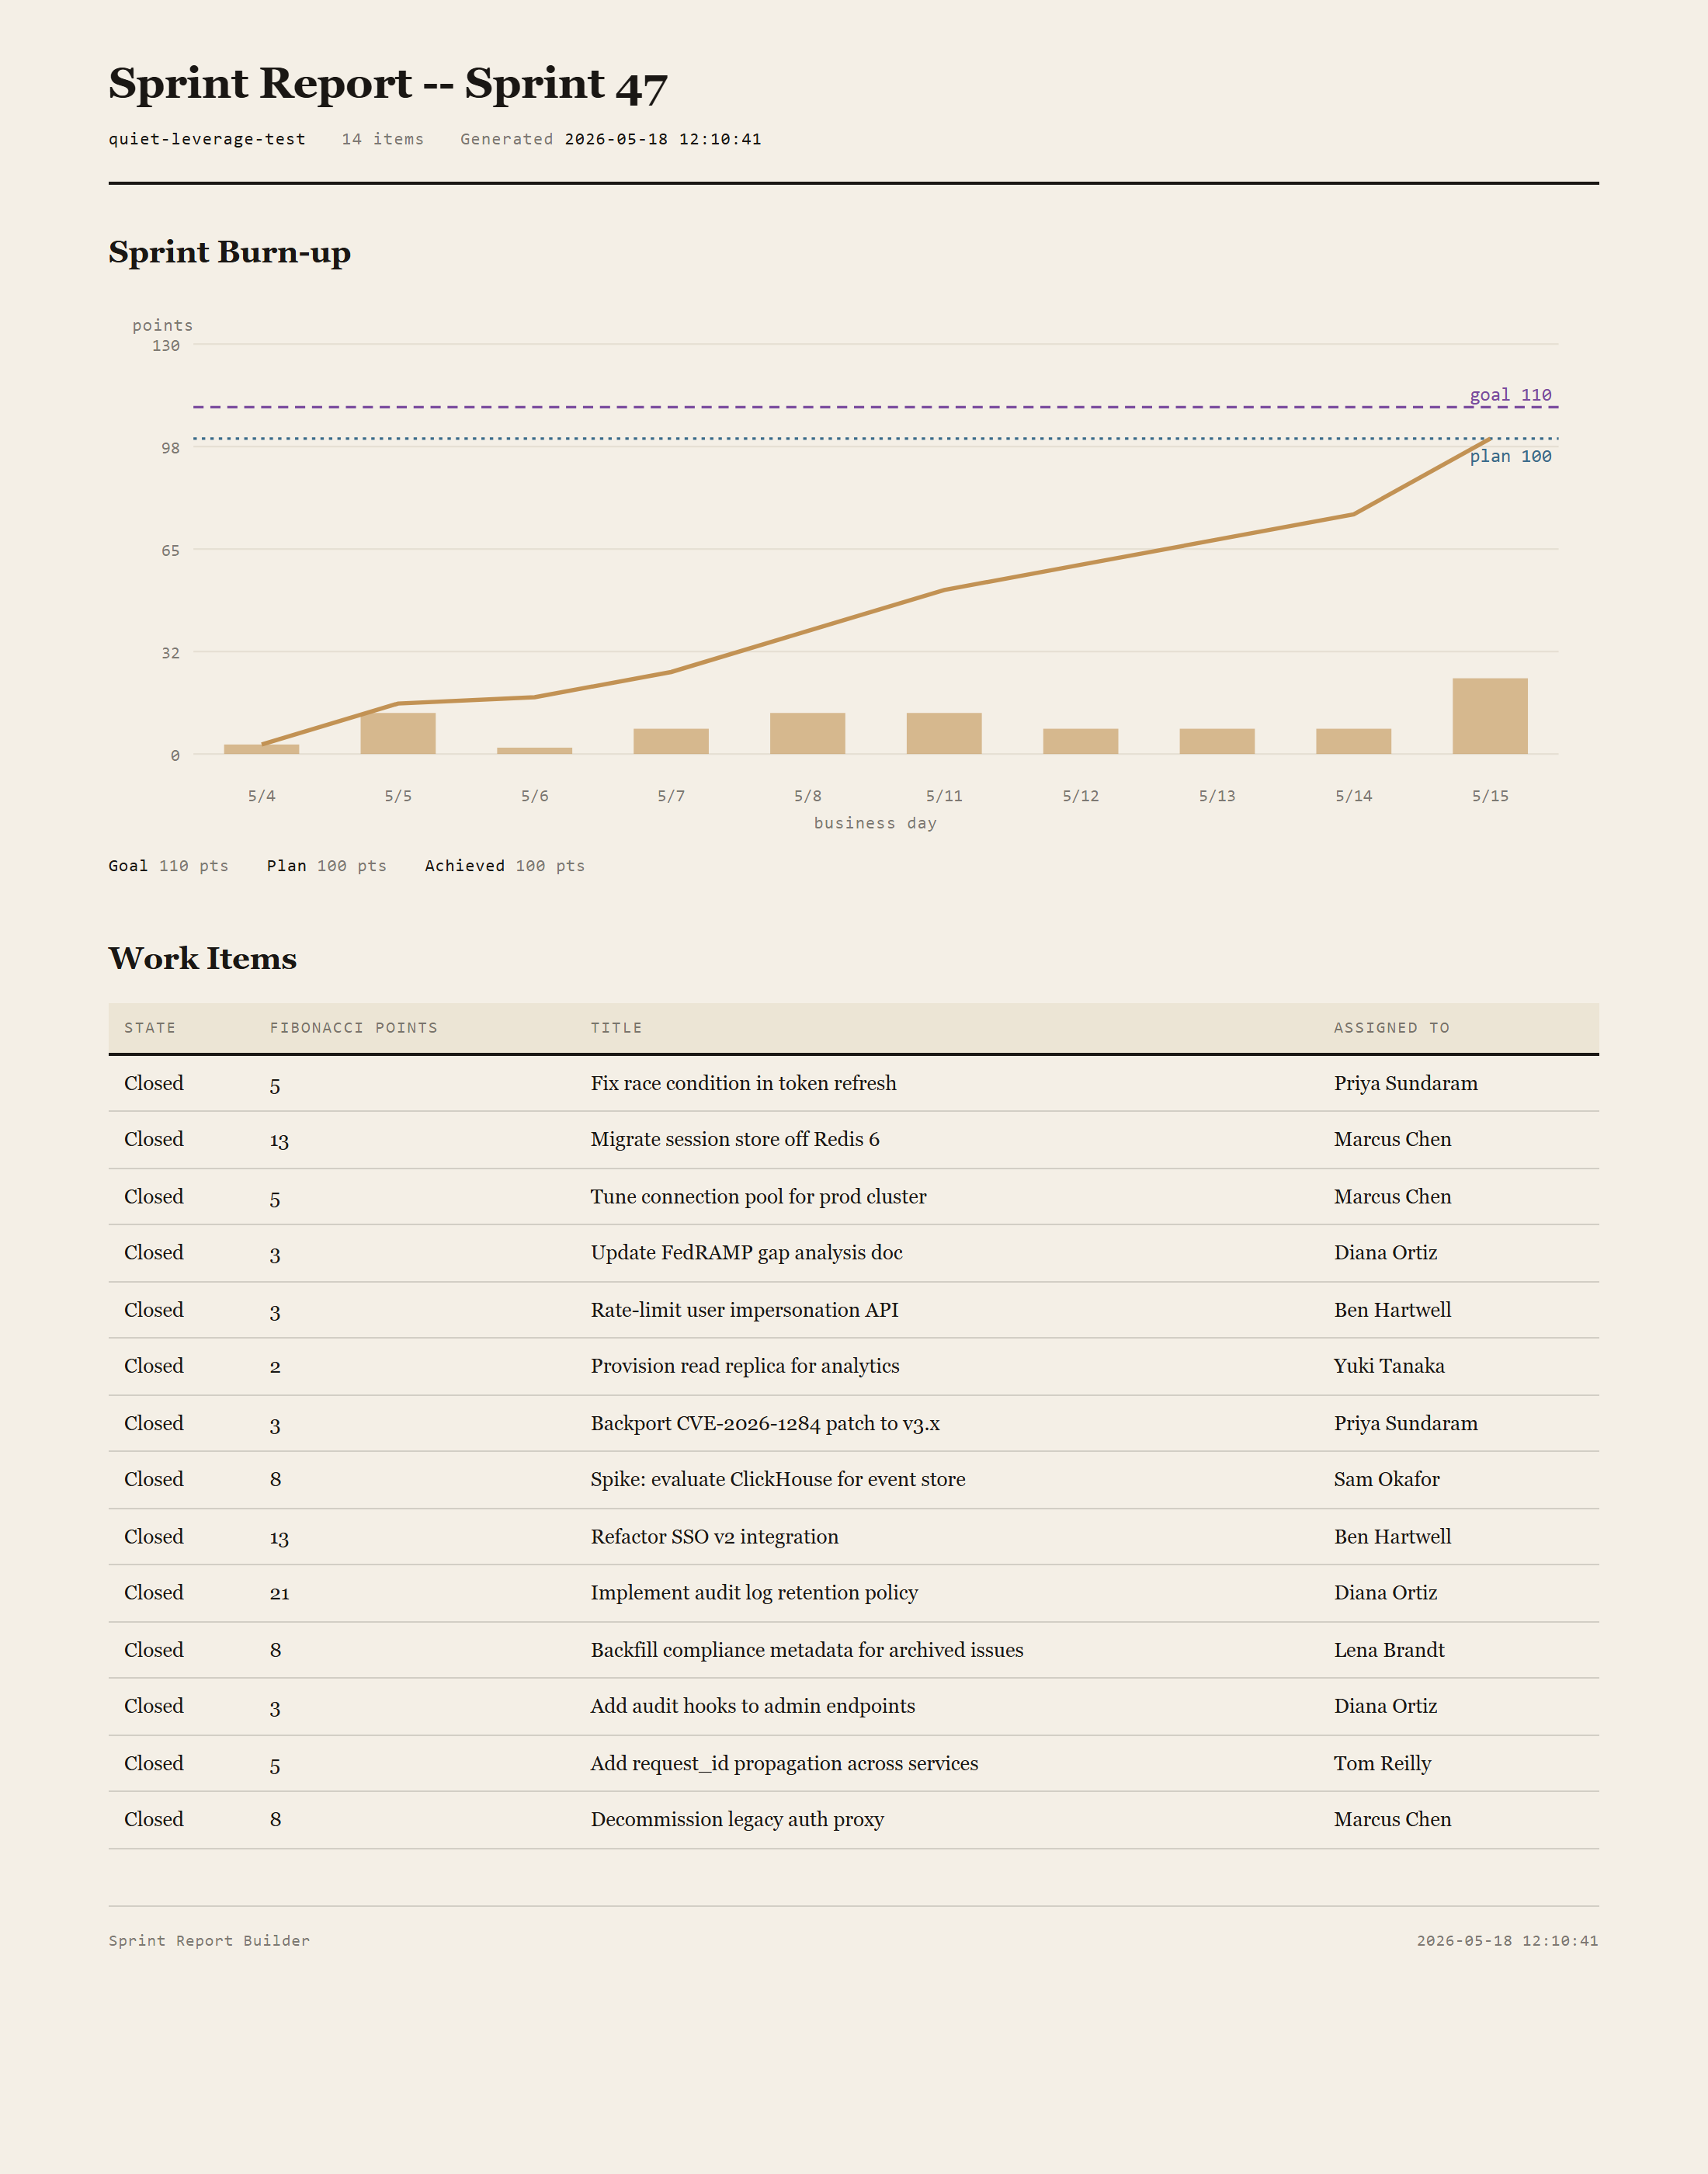
Sprint Burn-up
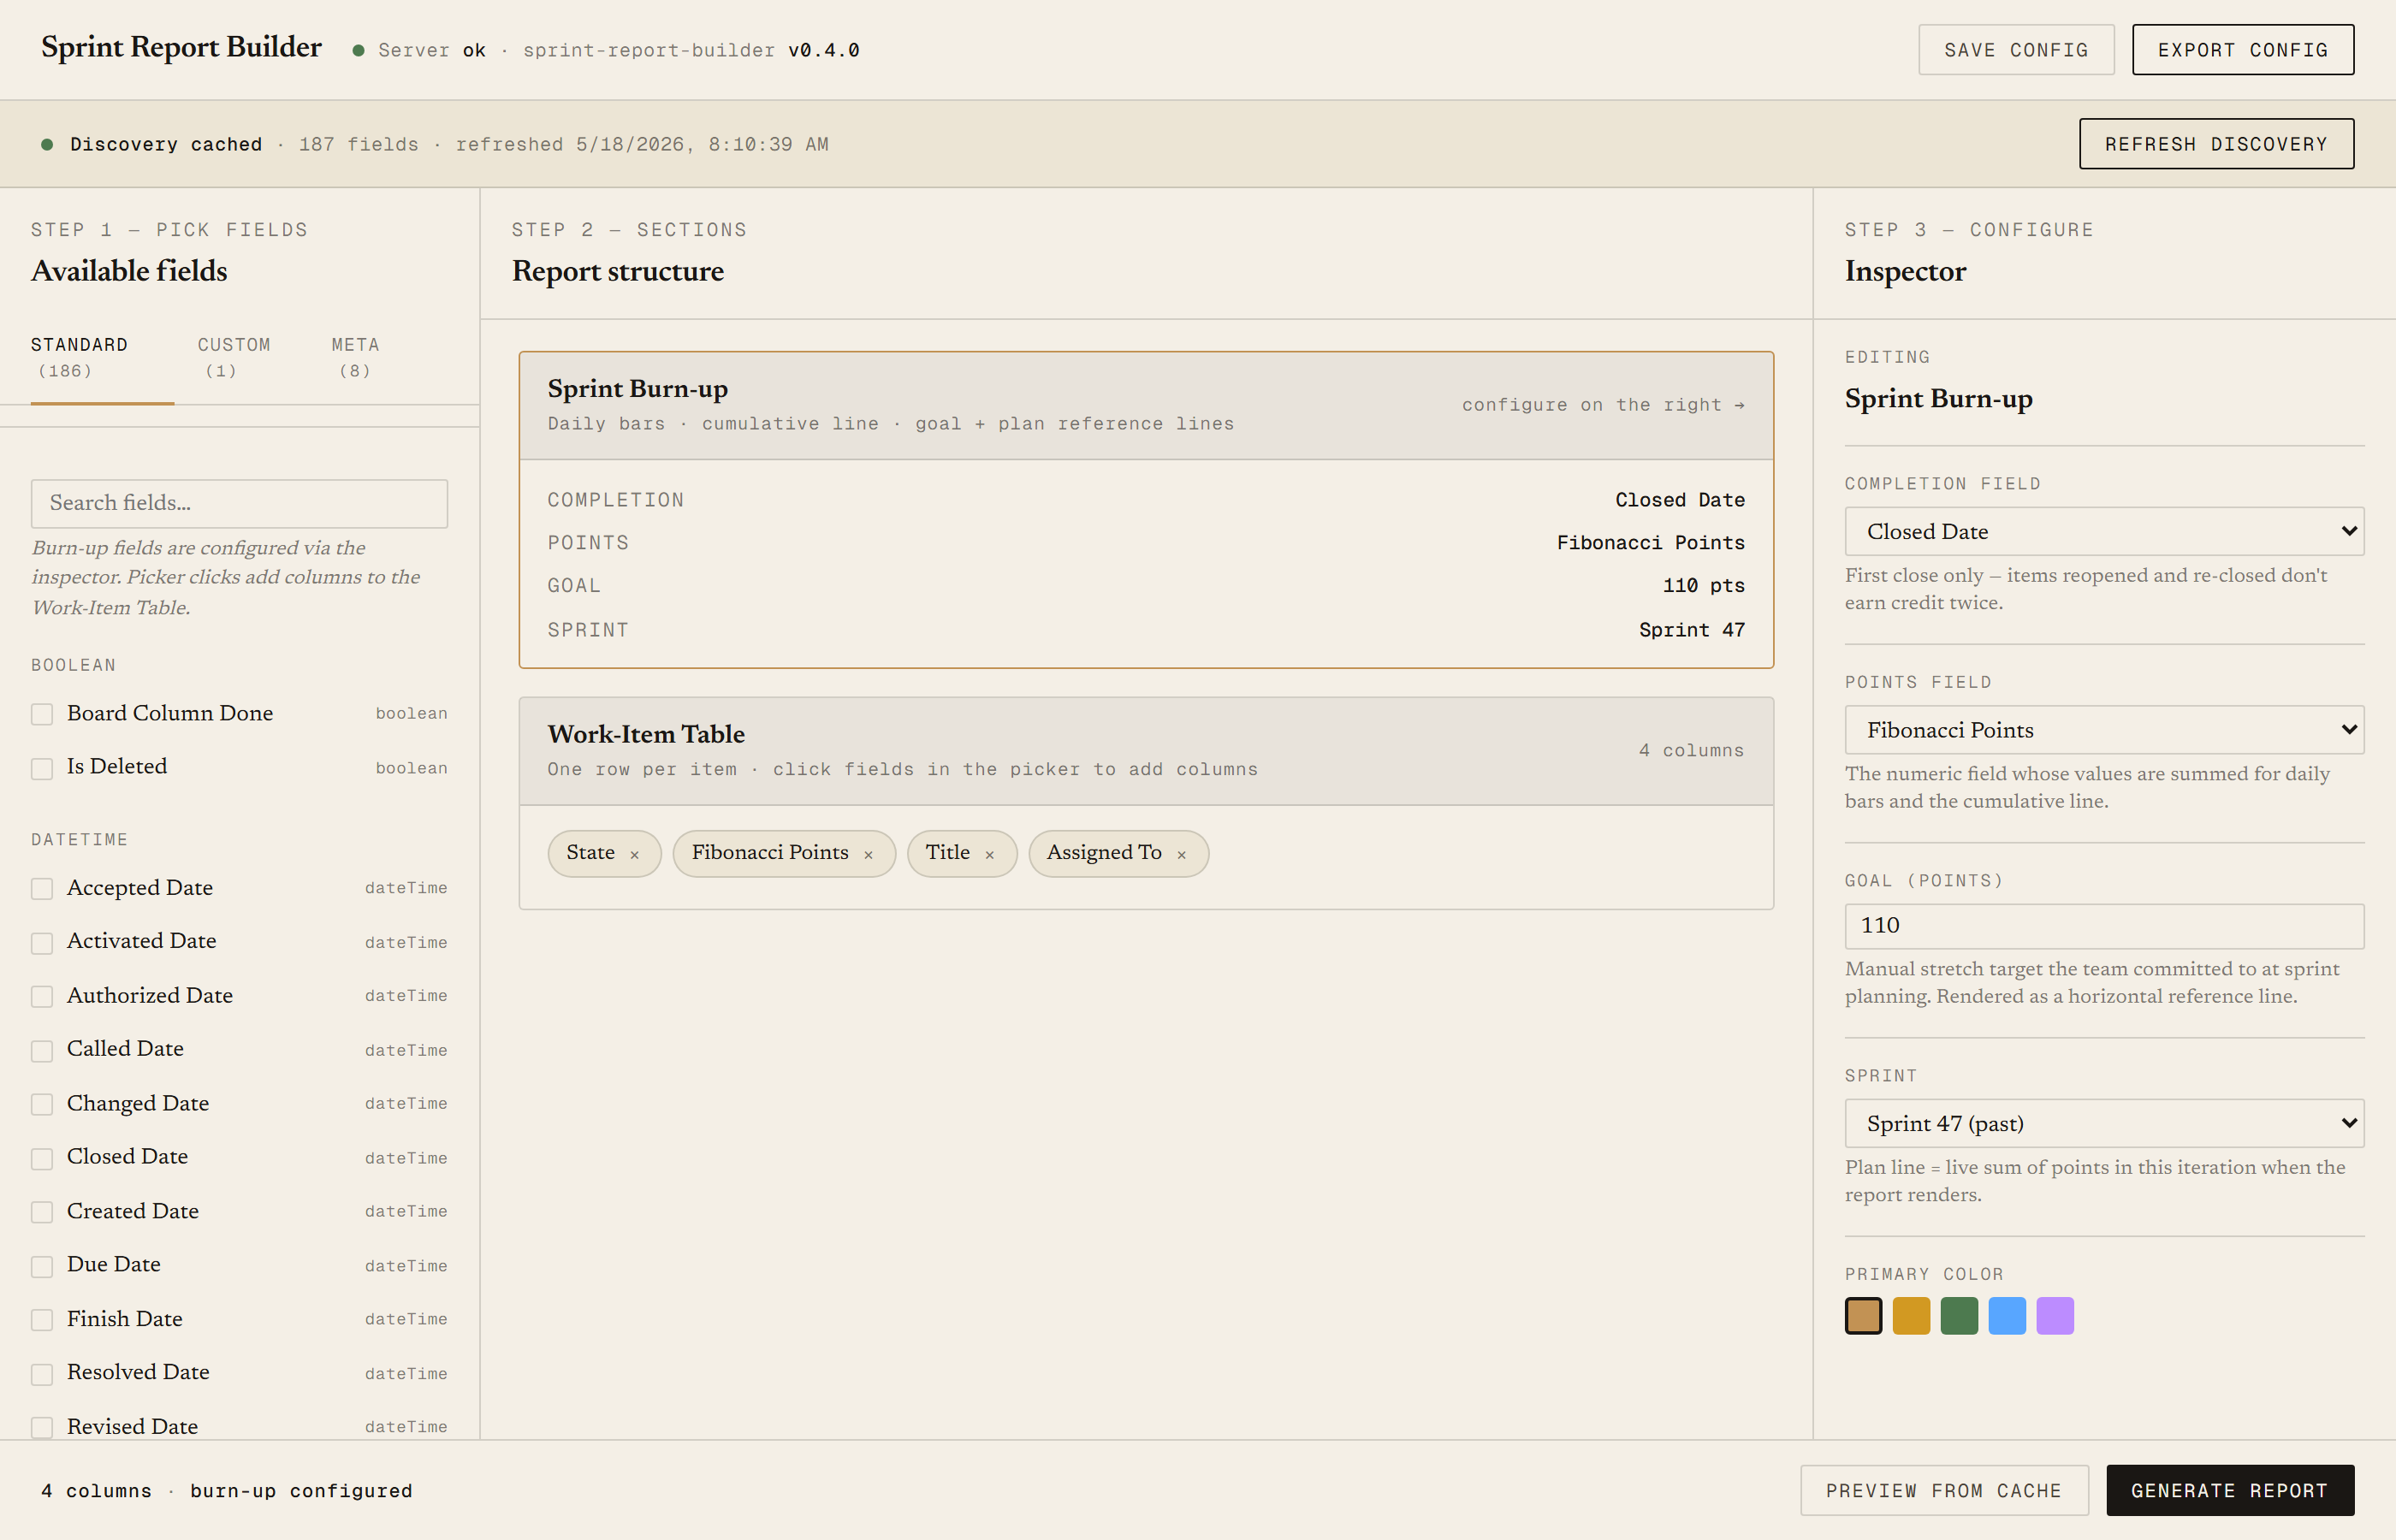
Daily bars for points achieved that day, cumulative line from zero, two horizontal references: a Goal line (manual stretch target the team committed to at sprint planning) and a Plan line (live sum of points in the iteration at render time). Achievement counts first close only — items reopened and re-closed don't earn credit twice.
Work-Item Table
Configurable columns; defaults are State / Story Points / Title / Assigned To. Sorts by state by default so Active and New items cluster up top. Optional state-banded grouping for sprint reviews where you want to walk the team through Done, then Active, then New.
Requirements
- OSWindows, macOS, or Linux
- RuntimePowerShell 7+ (
pwsh). Cross-platform: Windows, macOS, Linux. Windows PowerShell 5.1 is not supported. - BrowserAnything modern. The configuration UI is served on localhost.
- Azure DevOpsCloud (dev.azure.com) or self-hosted Server. Both supported.
- PAT scope
Work Items (Read)is enough for day-to-day use. - DataNever leaves your machine. The browser UI talks to a local PowerShell server; the server talks directly to Azure DevOps. Nothing is uploaded anywhere else.
Claude could write this. Two reasons to prefer the script.
Some workplaces — defense, medical devices, finance, anywhere with a strict IT policy — won't let Claude or any AI tool touch production data. These tools run on your machine, with no Claude or AI in the data path. Vendor data (in this case, your Azure DevOps organization) flows direct from your machine to Microsoft and back — no third-party SaaS in between, no telemetry, no tokens leaving your environment. And even where AI is allowed, repeat workflows shouldn't cost tokens — a deterministic script runs the same way every time, for free, forever. The prompt guide below shows how this tool was built with Claude; the download is what you run after.
Three files. Free.
The tool itself, a user guide that walks through setup and daily use, and a prompt guide that shows how I built it with Claude Code so you can build a similar tool for whatever your team uses.
Drop your email to unlock the downloads.
One email when new tools ship, digest only. Confirms via Kit (double opt-in). No tracking. Unlocks every download on the site from this browser.
./start.ps1, the browser opens. No installer.