Bug Aging Report
Jira's Average Age report gives you one number for the whole project. The QA manager's real question is two-dimensional: which bugs have been open too long, and how bad are they? This tool pulls every unresolved bug from your Jira project and builds an age × priority matrix — plus per-bucket tables, an oldest-unresolved callout, an oldest-Highest callout, and a bugs-by-component breakdown.
Average age is one number. Triage needs the matrix.
The Average Age report gives you a single average for the whole project.
Which doesn't tell you whether your 60-day average means "every bug is 60 days old" or "two bugs are 500 days old and the rest are fresh." Atlassian's own KB on the calculation says it directly:
"This cannot be measured by using Jira's native gadgets and reports for certain specialized aging metrics like measuring time spent in specific statuses. It is not possible within the built-in functionalities of Jira to create detailed defect aging reports with specific status-based breakdowns." Atlassian Support · How is the Jira average age report calculated?
A 100-day Low bug is different from a 100-day Highest bug.
Triage decisions cross two dimensions: how old, and how bad. QualityBits' "Visualizing Quality: How Old are Your Bugs?" piece makes the case for the cross-cut as the chart every QA lead wants and the one Jira doesn't ship. The marketplace fills it with paid third-party apps — another tool with its own auth and per-user license. In regulated environments, that's a procurement event.
A Highest bug aged 30+ days is a separate alarm.
Highest-priority bugs older than a month aren't slow triage — they're abandoned triage. Most QA managers want this called out separately, with a healthy-state explicit count when there are zero. v1 surfaces it as a dedicated callout with a healthy state ("0 Highest aged 30+ days") when the data is good, and a red-flag list when it isn't.
This tool addresses all three: a local PowerShell script that pulls every unresolved bug via the Jira REST API and renders a 4 × 4 age × priority matrix, per-bucket tables sorted worst-first, an oldest-unresolved callout (top 10), an oldest-Highest callout (separate alarm for aged Highest bugs), and a component breakdown.
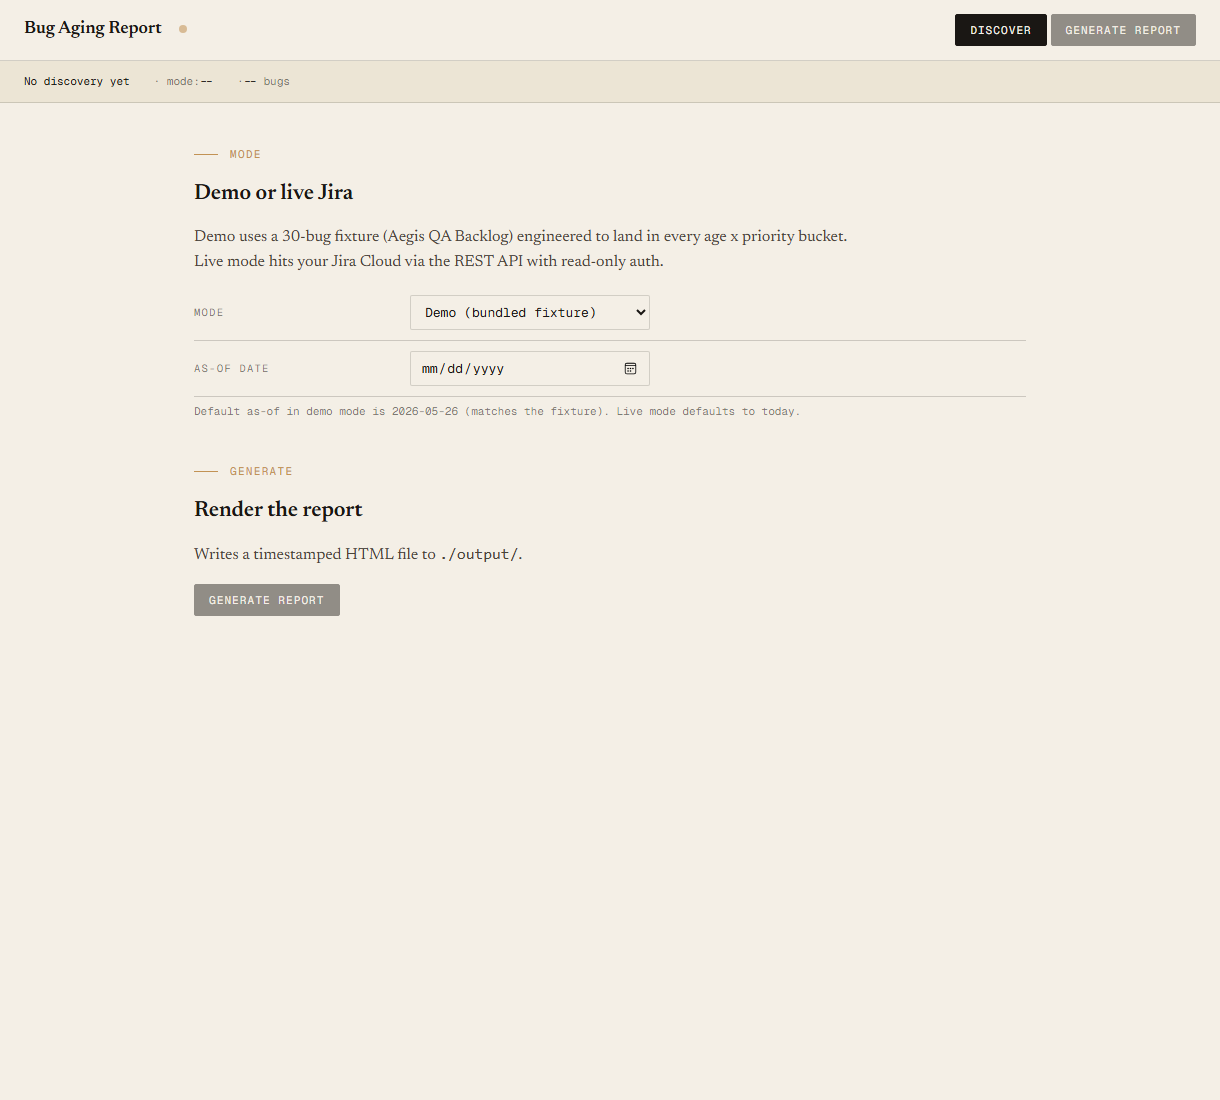
One page, an age x priority matrix, broken items first.
The output is a single self-contained HTML file written to ./output/. System fonts, no external CSS or JS, prints cleanly, embeds in email.
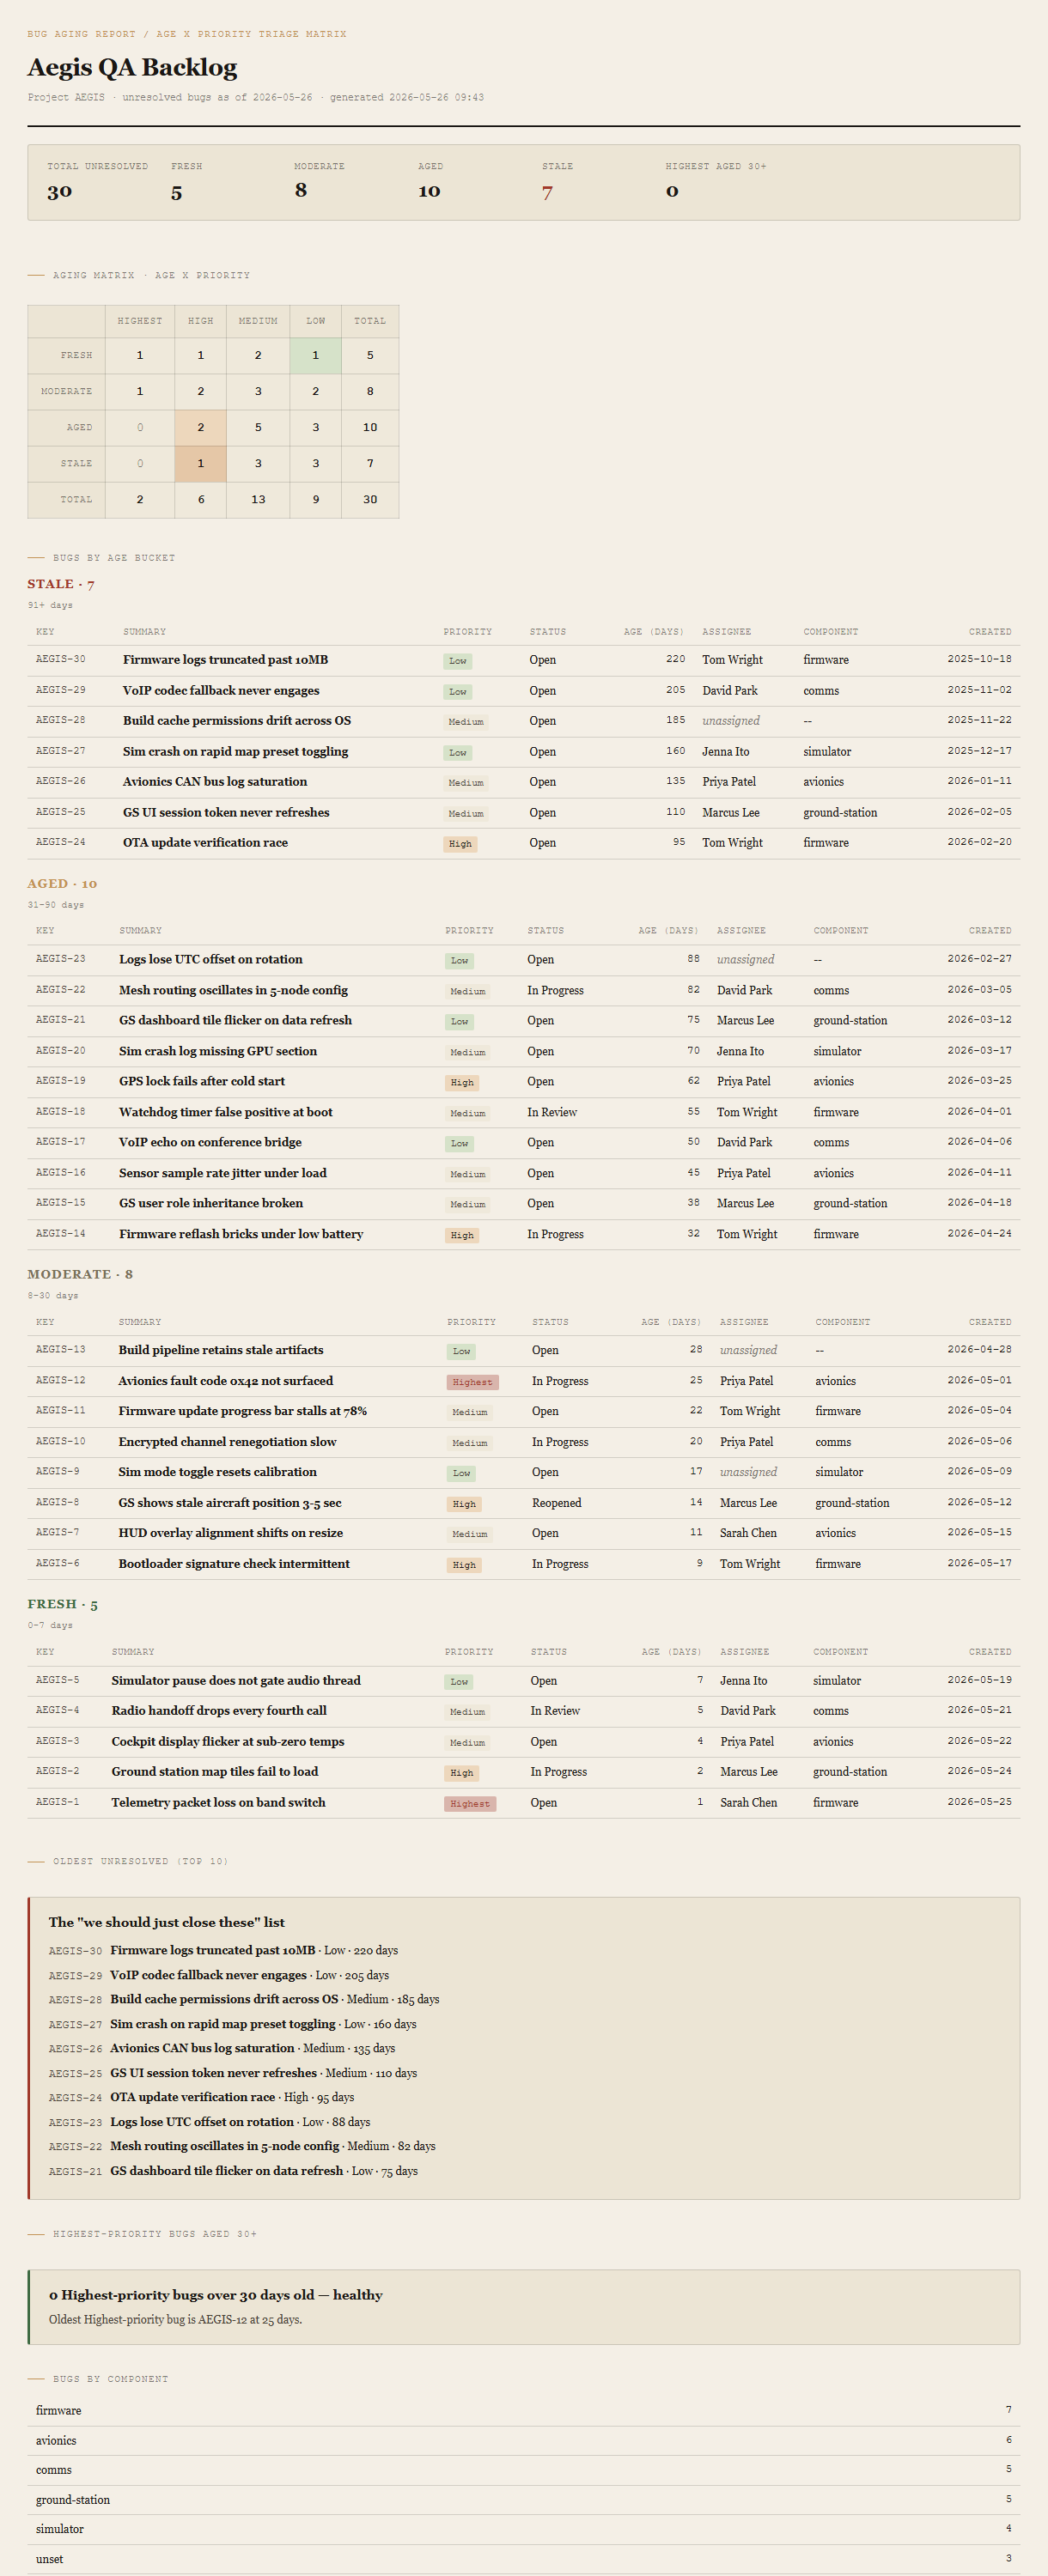
Summary header
Total unresolved bugs, count per age bucket (Fresh / Moderate / Aged / Stale), Stale count in red ochre. Count of Highest-priority bugs aged 30+ days — red ochre if non-zero, otherwise plain.
Aging matrix
Four rows (age buckets) by four columns (priorities). Cell colors encode severity: Highest-Stale is red, High-Stale and Highest-Aged are amber, the diagonal toward Low-Fresh is green. Row and column totals on the edges.
Bugs by age bucket
Four sub-sections (Stale → Aged → Moderate → Fresh). Each is a table sorted worst-first within the bucket: key, summary, priority tag, status, age in days, assignee, component, created date.
Oldest unresolved & oldest Highest
Two callouts. Oldest unresolved — top 10 by age, regardless of priority. Oldest Highest-priority — every Highest bug aged 30+ days, with a healthy-state message when zero (and the oldest Highest's age named for context).
Bugs by component
Small table grouped by component name, sorted by count descending. Bugs without a component get bucketed as "unset."
Requirements
- OSWindows, macOS, or Linux
- RuntimePowerShell 7+ (
pwsh). Windows PowerShell 5.1 is not supported. - BrowserAnything modern. Configuration UI is on
localhost:8777. - JiraCloud only in v1. Server / Data Center is a separate auth story; defer until demand.
- TokenPersonal API Token from id.atlassian.com. The tool only issues read requests; the token carries your Atlassian user's permissions.
- DataNever leaves your machine. The local PowerShell server talks directly to
your-site.atlassian.net; the browser only talks to the local server. - Demo modeBundled 30-bug Aegis QA Backlog fixture — the tool runs end-to-end without setting up Jira creds. Switch to live mode in the local UI when you're ready to point at your own project.
Claude could write this. Two reasons to prefer the script.
Some workplaces — defense, medical devices, finance, anywhere with a strict IT policy — won't let Claude or any AI tool touch production data. These tools run on your machine, with no Claude or AI in the data path. Vendor data (in this case, your Atlassian Cloud instance) flows direct from your machine to Atlassian and back — no third-party SaaS in between, no telemetry, no tokens leaving your environment. And even where AI is allowed, repeat workflows shouldn't cost tokens — a deterministic script runs the same way every time, for free, forever. The prompt guide below shows how this tool was built with Claude; the download is what you run after.
Three files. Free.
The tool itself, a user guide that walks through the demo run and the live-mode setup, and a prompt guide showing how this was built with Claude Code — the bucket thresholds, the priority mapping, the fixture engineering that pins exact matrix counts, and the Pester contract.
Drop your email to unlock the downloads.
One email when new tools ship, digest only. Confirms via Kit (double opt-in). No tracking. Unlocks every download on the site from this browser.
./start.ps1.