Stale Epics Report
Jira's Epic Report shows one epic at a time. Nobody asks about one epic at a time. The question is always which of our epics haven't moved in a while — and the native answer is "open them and check, one by one." This tool reads every epic in your project, classifies each by days since last activity (Fresh / Slowing / Stale / Cold / Frozen), and produces a single HTML page that names what to triage first.
Native Jira reports go epic-by-epic. Triage needs the opposite.
Epic Report, Epic Burndown, Roadmap — all single-epic views.
Jira ships three native epic views, and each one shows you a single epic at a time. There is no built-in "rank every epic in this project by days since activity." Tempo's own blog on epic reporting puts it directly:
"Agile teams, RTEs, and program managers face a common challenge: tracking delivery progress across multiple epics, teams, and boards without clear visibility, as Jira's native reporting falls short when you need epic-level insights that span projects." Tempo · How to Do Epic Reporting in Jira
The marketplace fills the gap with third-party apps. Every one adds a tool with its own auth, its own data-residency story, and another per-user license. For program managers in regulated environments, that's a non-starter.
The data is in the changelog. The view isn't.
brokenbuild.net documents the missing chart explicitly:
"Since Jira doesn't offer a native Epic Time in Status chart..." brokenbuild.net · Epic Time in Status
Every epic's full activity history is sitting in changelog, accessible via REST. Nobody walks it because the UI doesn't.
"Is this epic stuck?" needs a magnitude.
An epic untouched 14 days is in-flight friction. An epic untouched 60 days needs a conversation. An epic untouched 180 days is dead. The action is different for each. Without a magnitude bucket, the program manager either ignores everything stale (false negatives pile up) or chases every yellow indicator (alarm fatigue).
This tool addresses all three: a local PowerShell script that walks every epic in a Jira project via the REST API, classifies each by days since activity into five buckets (Frozen / Cold / Stale / Slowing / Fresh), and produces a single HTML page worst-first — with a "what's still moving" callout for the trust signal and a "no children" list for the epics that probably need closing.
One page, five buckets, broken items lead.
The output is a single self-contained HTML file written to ./output/. System fonts, no external CSS or JS, prints cleanly, embeds in email. Four sections; the order surfaces what needs triage first.
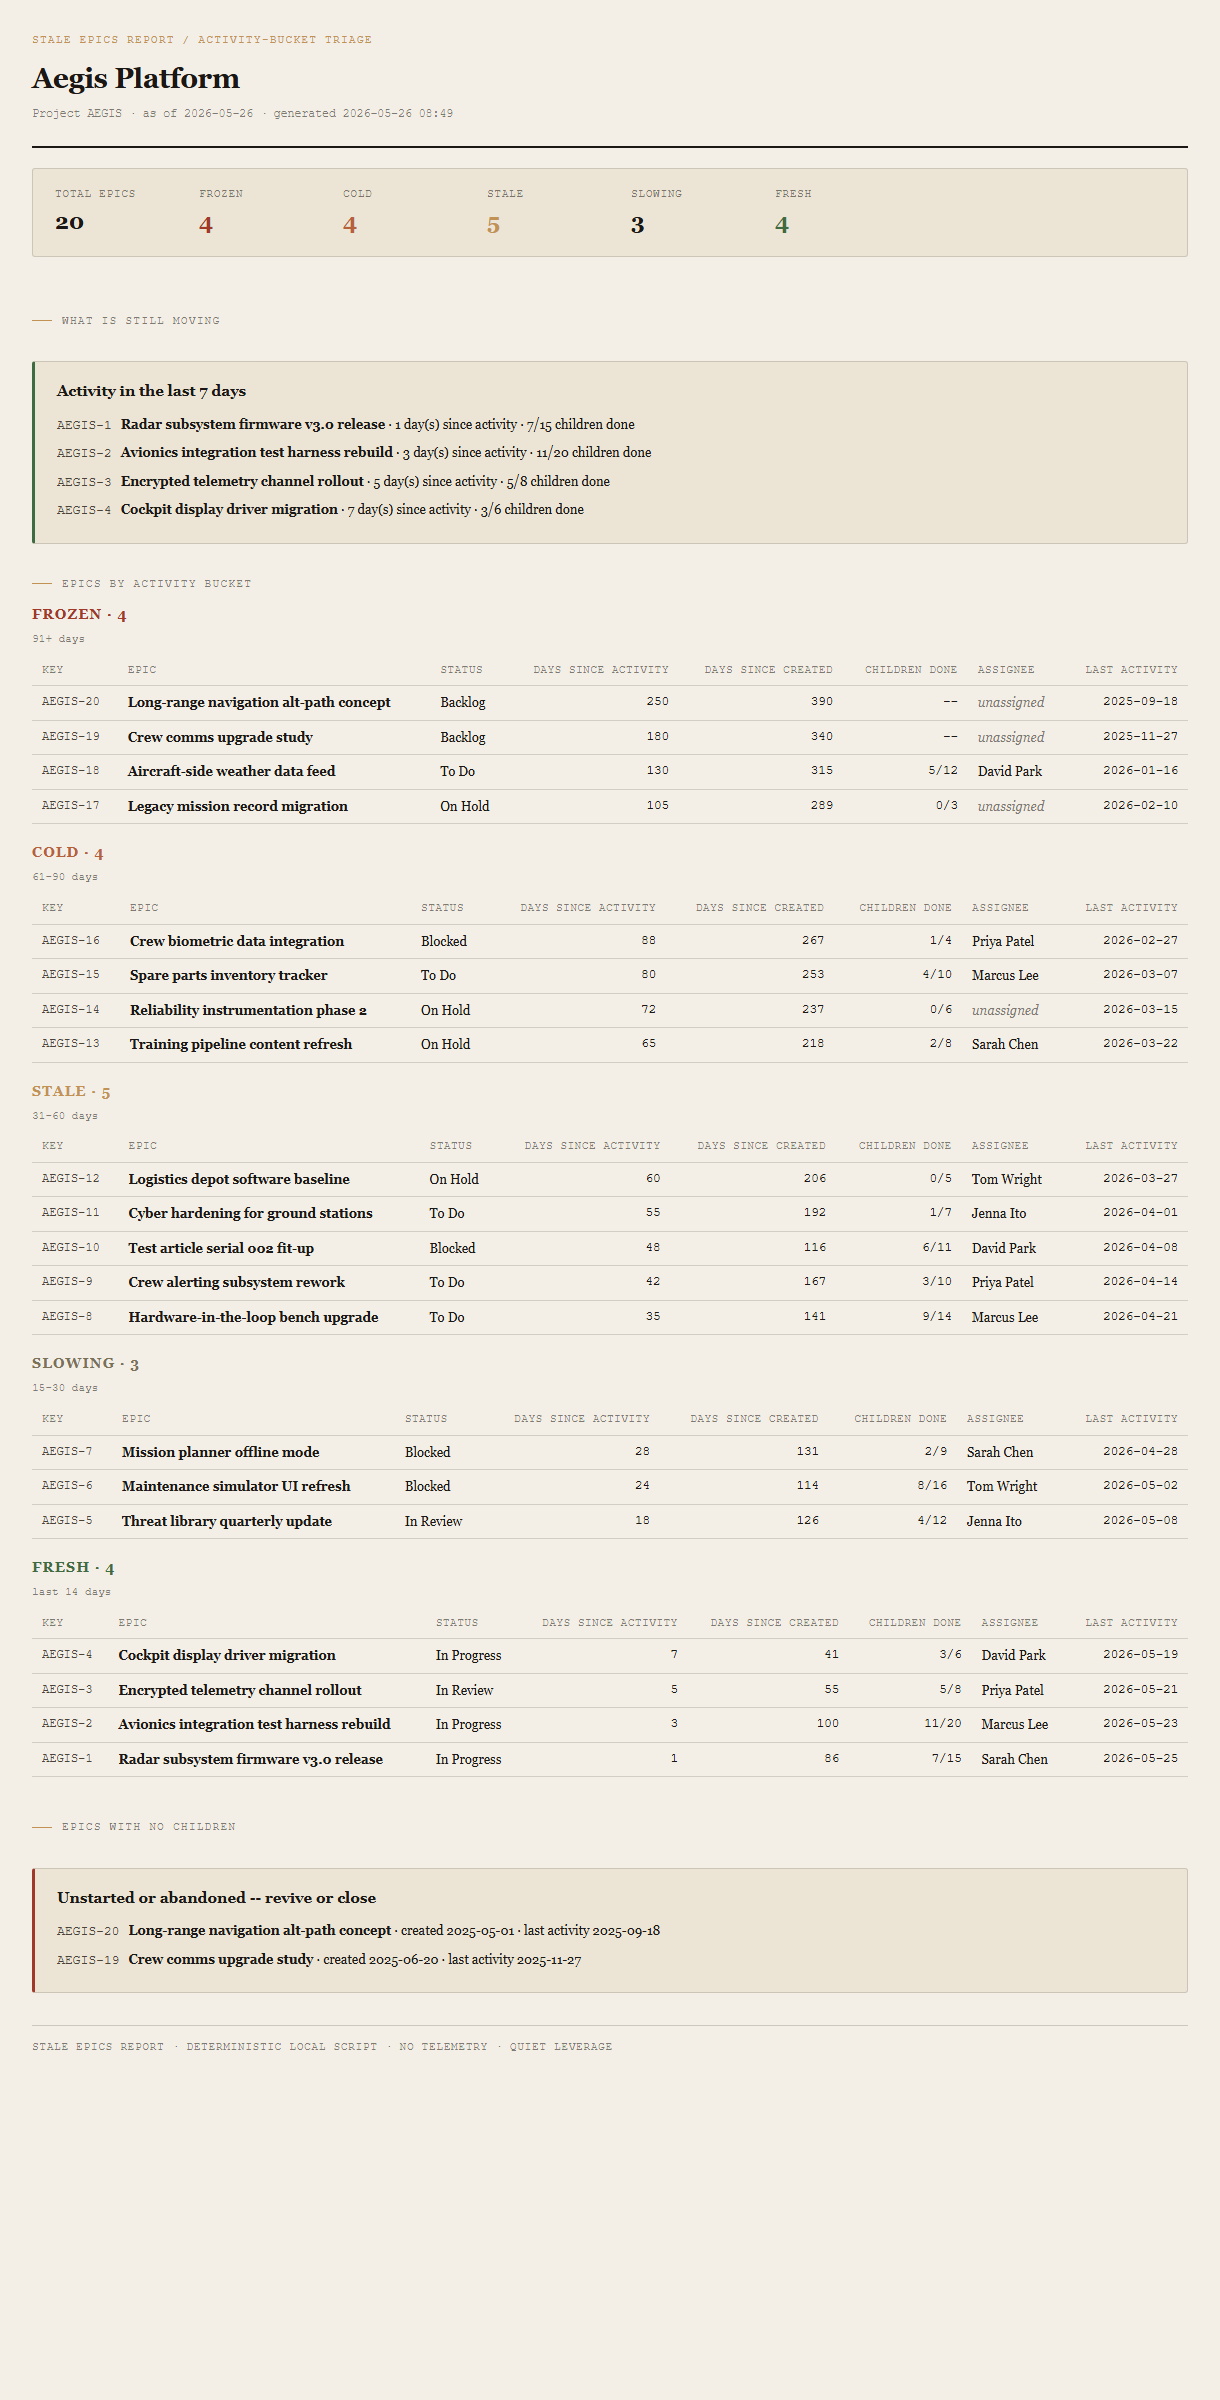
Summary header
Total epics, count per bucket (Frozen / Cold / Stale / Slowing / Fresh), as-of date. The Frozen count is in red ochre so the headline lands first.
What's still moving
Callout listing epics with activity in the last 7 days. The trust signal — "here's what's healthy, before we look at what's not." Each entry: epic key, summary, days since activity, child-issue completion.
Epics by activity bucket
Five sub-sections in order Frozen → Cold → Stale → Slowing → Fresh. Each is a table sorted worst-first within the bucket: epic key + summary, status, days since activity, days since created, children done vs total, assignee, last activity date.
Epics with no children
The unstarted or abandoned pile. Listed separately so the program manager can decide: revive (assign work) or close (resolve, archive, move on).
Requirements
- OSWindows, macOS, or Linux
- RuntimePowerShell 7+ (
pwsh). Windows PowerShell 5.1 is not supported. - BrowserAnything modern. Configuration UI is on
localhost:8776. - JiraCloud only in v1. Server / Data Center is a separate auth story; defer until demand.
- TokenPersonal API Token from id.atlassian.com. The tool only issues read requests; the token carries your Atlassian user's permissions.
- DataNever leaves your machine. The local PowerShell server talks directly to
your-site.atlassian.net; the browser only talks to the local server. - Demo modeBundled 20-epic Aegis Platform fixture — the tool runs end-to-end without setting up Jira creds. Switch to live mode in the local UI when you're ready to point at your own project.
Claude could write this. Two reasons to prefer the script.
Some workplaces — defense, medical devices, finance, anywhere with a strict IT policy — won't let Claude or any AI tool touch production data. These tools run on your machine, with no Claude or AI in the data path. Vendor data (in this case, your Atlassian Cloud instance) flows direct from your machine to Atlassian and back — no third-party SaaS in between, no telemetry, no tokens leaving your environment. And even where AI is allowed, repeat workflows shouldn't cost tokens — a deterministic script runs the same way every time, for free, forever. The prompt guide below shows how this tool was built with Claude; the download is what you run after.
Three files. Free.
The tool itself, a user guide that walks through the demo run and the live-mode setup, and a prompt guide showing how this was built with Claude Code — the spec, the bucket-classification rule set, the fixture engineering that pins exact bucket counts, and the Pester contract.

Drop your email to unlock the downloads.
One email when new tools ship, digest only. Confirms via Kit (double opt-in). No tracking. Unlocks every download on the site from this browser.
./start.ps1.