Velocity Drift Report
Jira's Velocity Chart shows the team's committed vs delivered as one bar pair per sprint. That hides the per-assignee story. When the team consistently delivers 83% of what it commits, the conversation isn't "the team is over-promising" — it's "two engineers are over-promising, one is sandbagging, the rest are fine, and the verdict needs to name them." This tool walks the last six sprints, flags chronic patterns per assignee, and renders a one-page report with a GREEN/AMBER/RED verdict at the top.
Drift is a team aggregate. The fix is per-assignee.
"The team delivered 83%" doesn't tell you who to talk to.
Jira's built-in Velocity Chart aggregates committed and delivered at the sprint level. It's the right view for "should we plan less next sprint" but the wrong view for "who needs the one-on-one." Most teams that consistently miss don't miss uniformly — a couple of people are dragging the average, and the rest are clean. The aggregate hides it.
Two failure modes. Two different conversations.
An over-promiser commits 8 points, delivers 5. A sandbagger commits 4, delivers 7. Both are estimation problems. The conversations are opposite: over-promisers need help breaking work down; sandbaggers need their committed scope expanded. The aggregate report shows them both as "deviation" without naming which.
Sprint 24-03 was bad. So was 24-02. And 24-01. And 23-14.
One sprint at 70% is a snowstorm. Four sprints at 70% is a planning practice. The chronic detection — under-delivery in 4+ of the last 6 sprints — is what justifies an intervention. The single-sprint view doesn't reveal it; the trend table does.
This tool addresses all three: a local PowerShell script that reads the last 6 closed sprints, computes per-sprint committed vs delivered, classifies each assignee as sandbagger / over-promiser / clean, and renders a single self-contained HTML report.
One page. Six sections. Verdict + per-assignee table.
The output is a single self-contained HTML file written to ./output/.
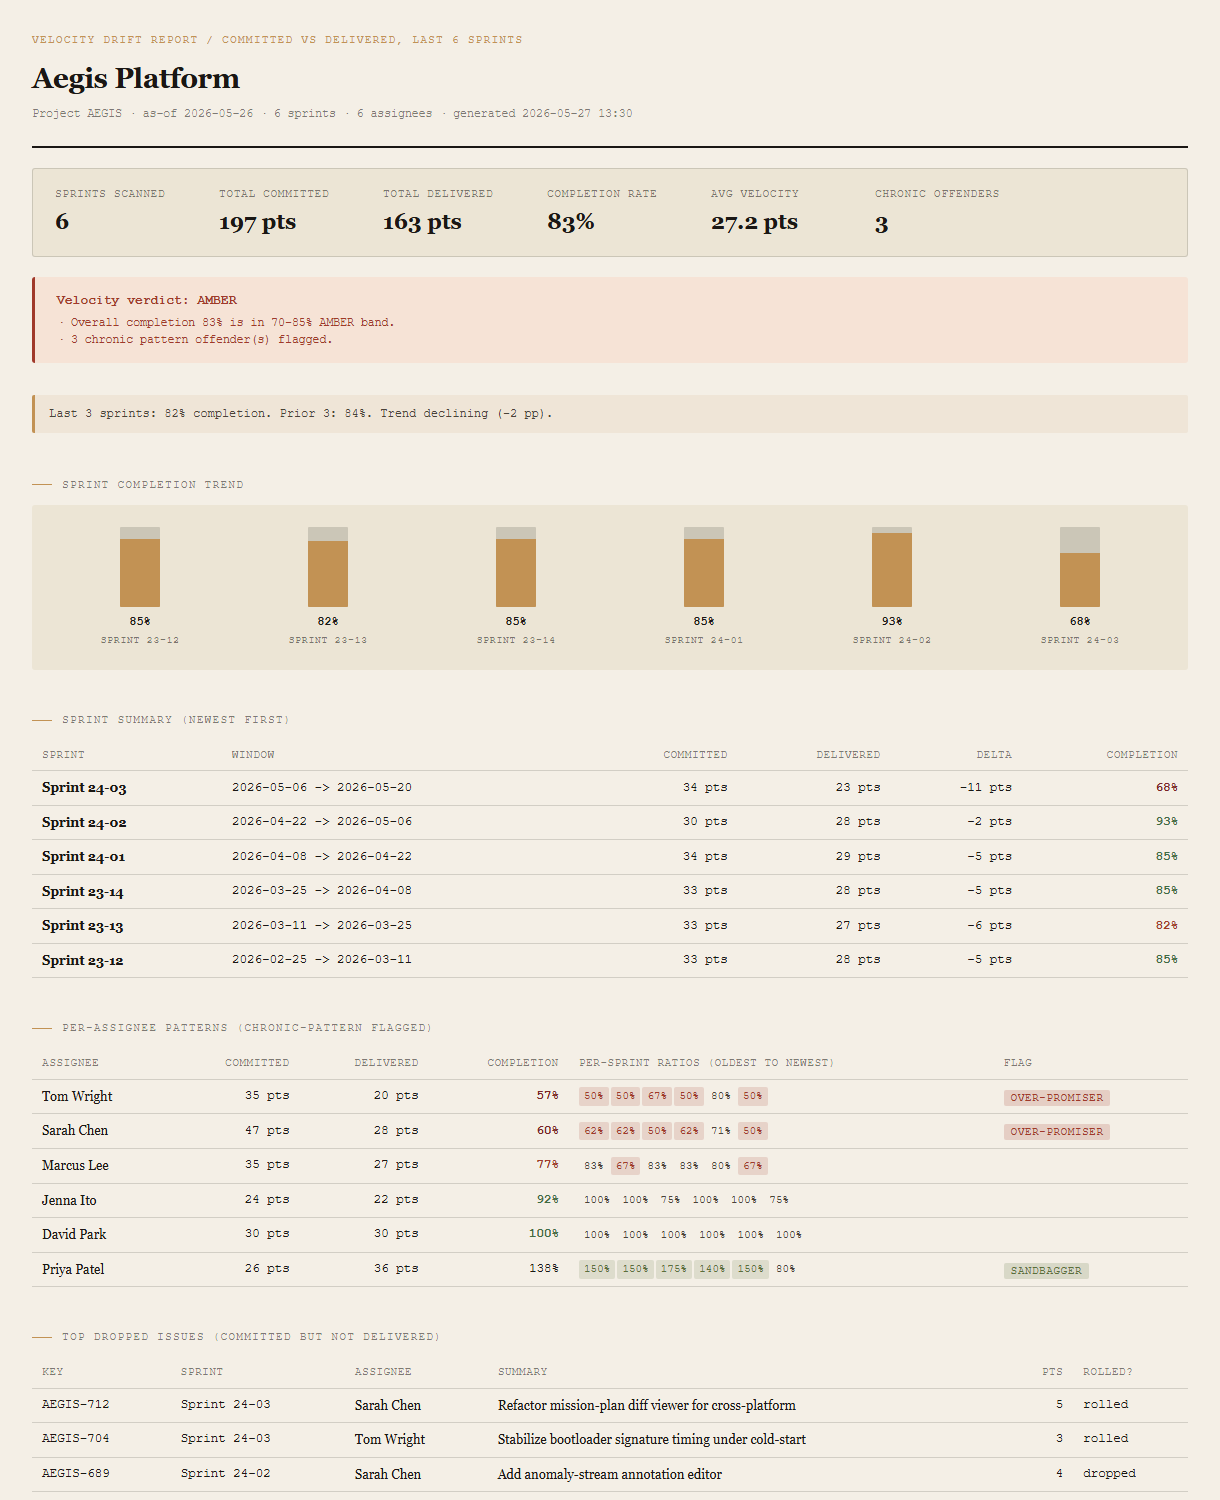
Summary + verdict
Sprints scanned, total committed/delivered, completion rate, average velocity, chronic-offender count. The verdict block beneath shows GREEN / AMBER / RED with the specific thresholds that triggered it.
Trend note + sprint completion bars
Compares the last 3 sprints to the prior 3 with a directional read ("trend declining 2pp"). The bar chart shows the per-sprint completion percentages so the recent-vs-historical story is visible at a glance.
Sprint summary table
One row per sprint, newest first: window, committed pts, delivered pts, delta, completion %. Color-coded so RED sprints (under 70%) and AMBER sprints (70-85%) surface immediately.
Per-assignee patterns
One row per assignee, sorted by completion %. Per-sprint ratio strip (color-coded: miss = red, sandbag = green, neutral = plain). Chronic flag column: Sandbagger if delivers >=130% of committed in 4+ sprints; Over-promiser if <=70% in 4+ sprints.
Top dropped issues
The specific issues that were committed but not delivered. Key, sprint, assignee, summary, points, and whether the issue rolled to the next sprint or got dropped entirely. The drill-down for the verdict.
Requirements
- OSWindows, macOS, or Linux
- RuntimePowerShell 7+ (
pwsh). 5.1 is not supported. - BrowserAnything modern. UI on
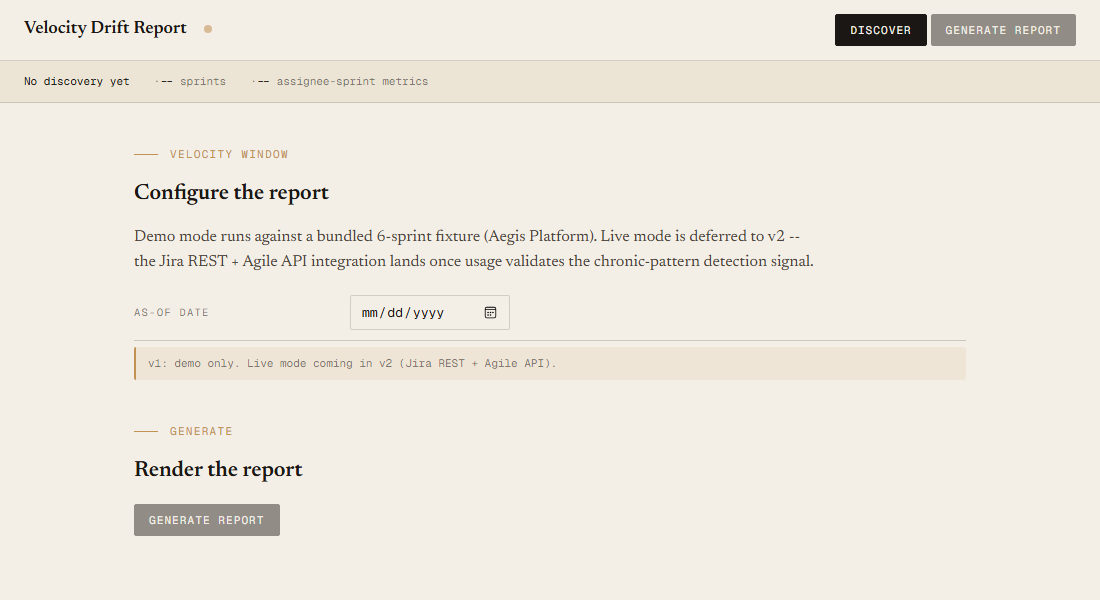
localhost:8782. - JiraLive mode deferred to v2 — Jira REST + Agile API (Personal API Token + email + site URL, via env vars or
~/.jira-config.json). v1 demonstrates the report shape on a bundled fixture. - Demo modeBundled 6-sprint / 6-assignee Aegis Platform fixture, AMBER verdict — runs end-to-end with no creds.
Claude could write this. Two reasons to prefer the script.
Some workplaces — defense, medical devices, finance, anywhere with a strict IT policy — won't let Claude or any AI tool touch production data. These tools run on your machine, with no Claude or AI in the data path. Vendor data (in this case, your Jira instance's sprint and issue data) flows direct from your machine to your-tenant.atlassian.net and back — no third-party SaaS in between, no telemetry, no tokens leaving your environment. And even where AI is allowed, repeat workflows shouldn't cost tokens — a deterministic script runs the same way every time, for free, forever. The prompt guide below shows how this tool was built with Claude; the download is what you run after.
Three files. Free.
The tool, a user guide, and a prompt guide showing the spec, the chronic-pattern detection thresholds, the verdict heuristics, the v1/v2 scope split, and the Pester contract that pins the demo numbers.
Drop your email to unlock the downloads.
One email when new tools ship, digest only. Confirms via Kit (double opt-in). No tracking. Unlocks every download on the site from this browser.
./start.ps1.