Baseline Drift Report
Project supports 11 baselines per schedule. The native Multiple Baselines Gantt view shows three. This tool reads every populated baseline from your Project XML and produces a single HTML report ranking tasks by cumulative drift across re-baselines — with a stable-tasks list as the credibility signal.
Re-baselining is invisible from inside Project.
Multiple Baselines Gantt is documented-broken.
Bonnie Biafore (Microsoft MVP) names the limitation directly: the Multiple Baselines Gantt view ships configured to display bars for only Baseline, Baseline1, and Baseline2 — not the current schedule, not Baseline3 through Baseline10. Reconfiguring it to show more requires custom-view edits most PMs don't do. The cap is presentational, not data: all 11 baselines are sitting in the XML, just unrendered.
"Multiple Baselines Gantt shows task bars for only Baseline, Baseline1, and Baseline2. It doesn't display task bars for the current schedule." Bonnie Biafore (MVP) · Working with Multiple Project Baselines
"We said Q2. Then Q3. Then Q4." needs to be one number.
Project shows variance against ONE baseline at a time. Steering committees want the cumulative story: "this task has been re-promised three times for a total of N working days of drift." Getting that means exporting BaselineN Finish fields for every leaf task to Excel, transposing, and computing deltas by hand. The PM does this every reporting cycle. The PM has done this every reporting cycle since Project 2010.
The good news is invisible too.
Re-baseline reports universally focus on what moved. They never name the tasks that survived every re-plan untouched. Those tasks are the trust signal — "we said this would happen on this date in the original plan, and it's still on that date today." Project doesn't surface them; this tool does, in a dedicated section the customer can read first.
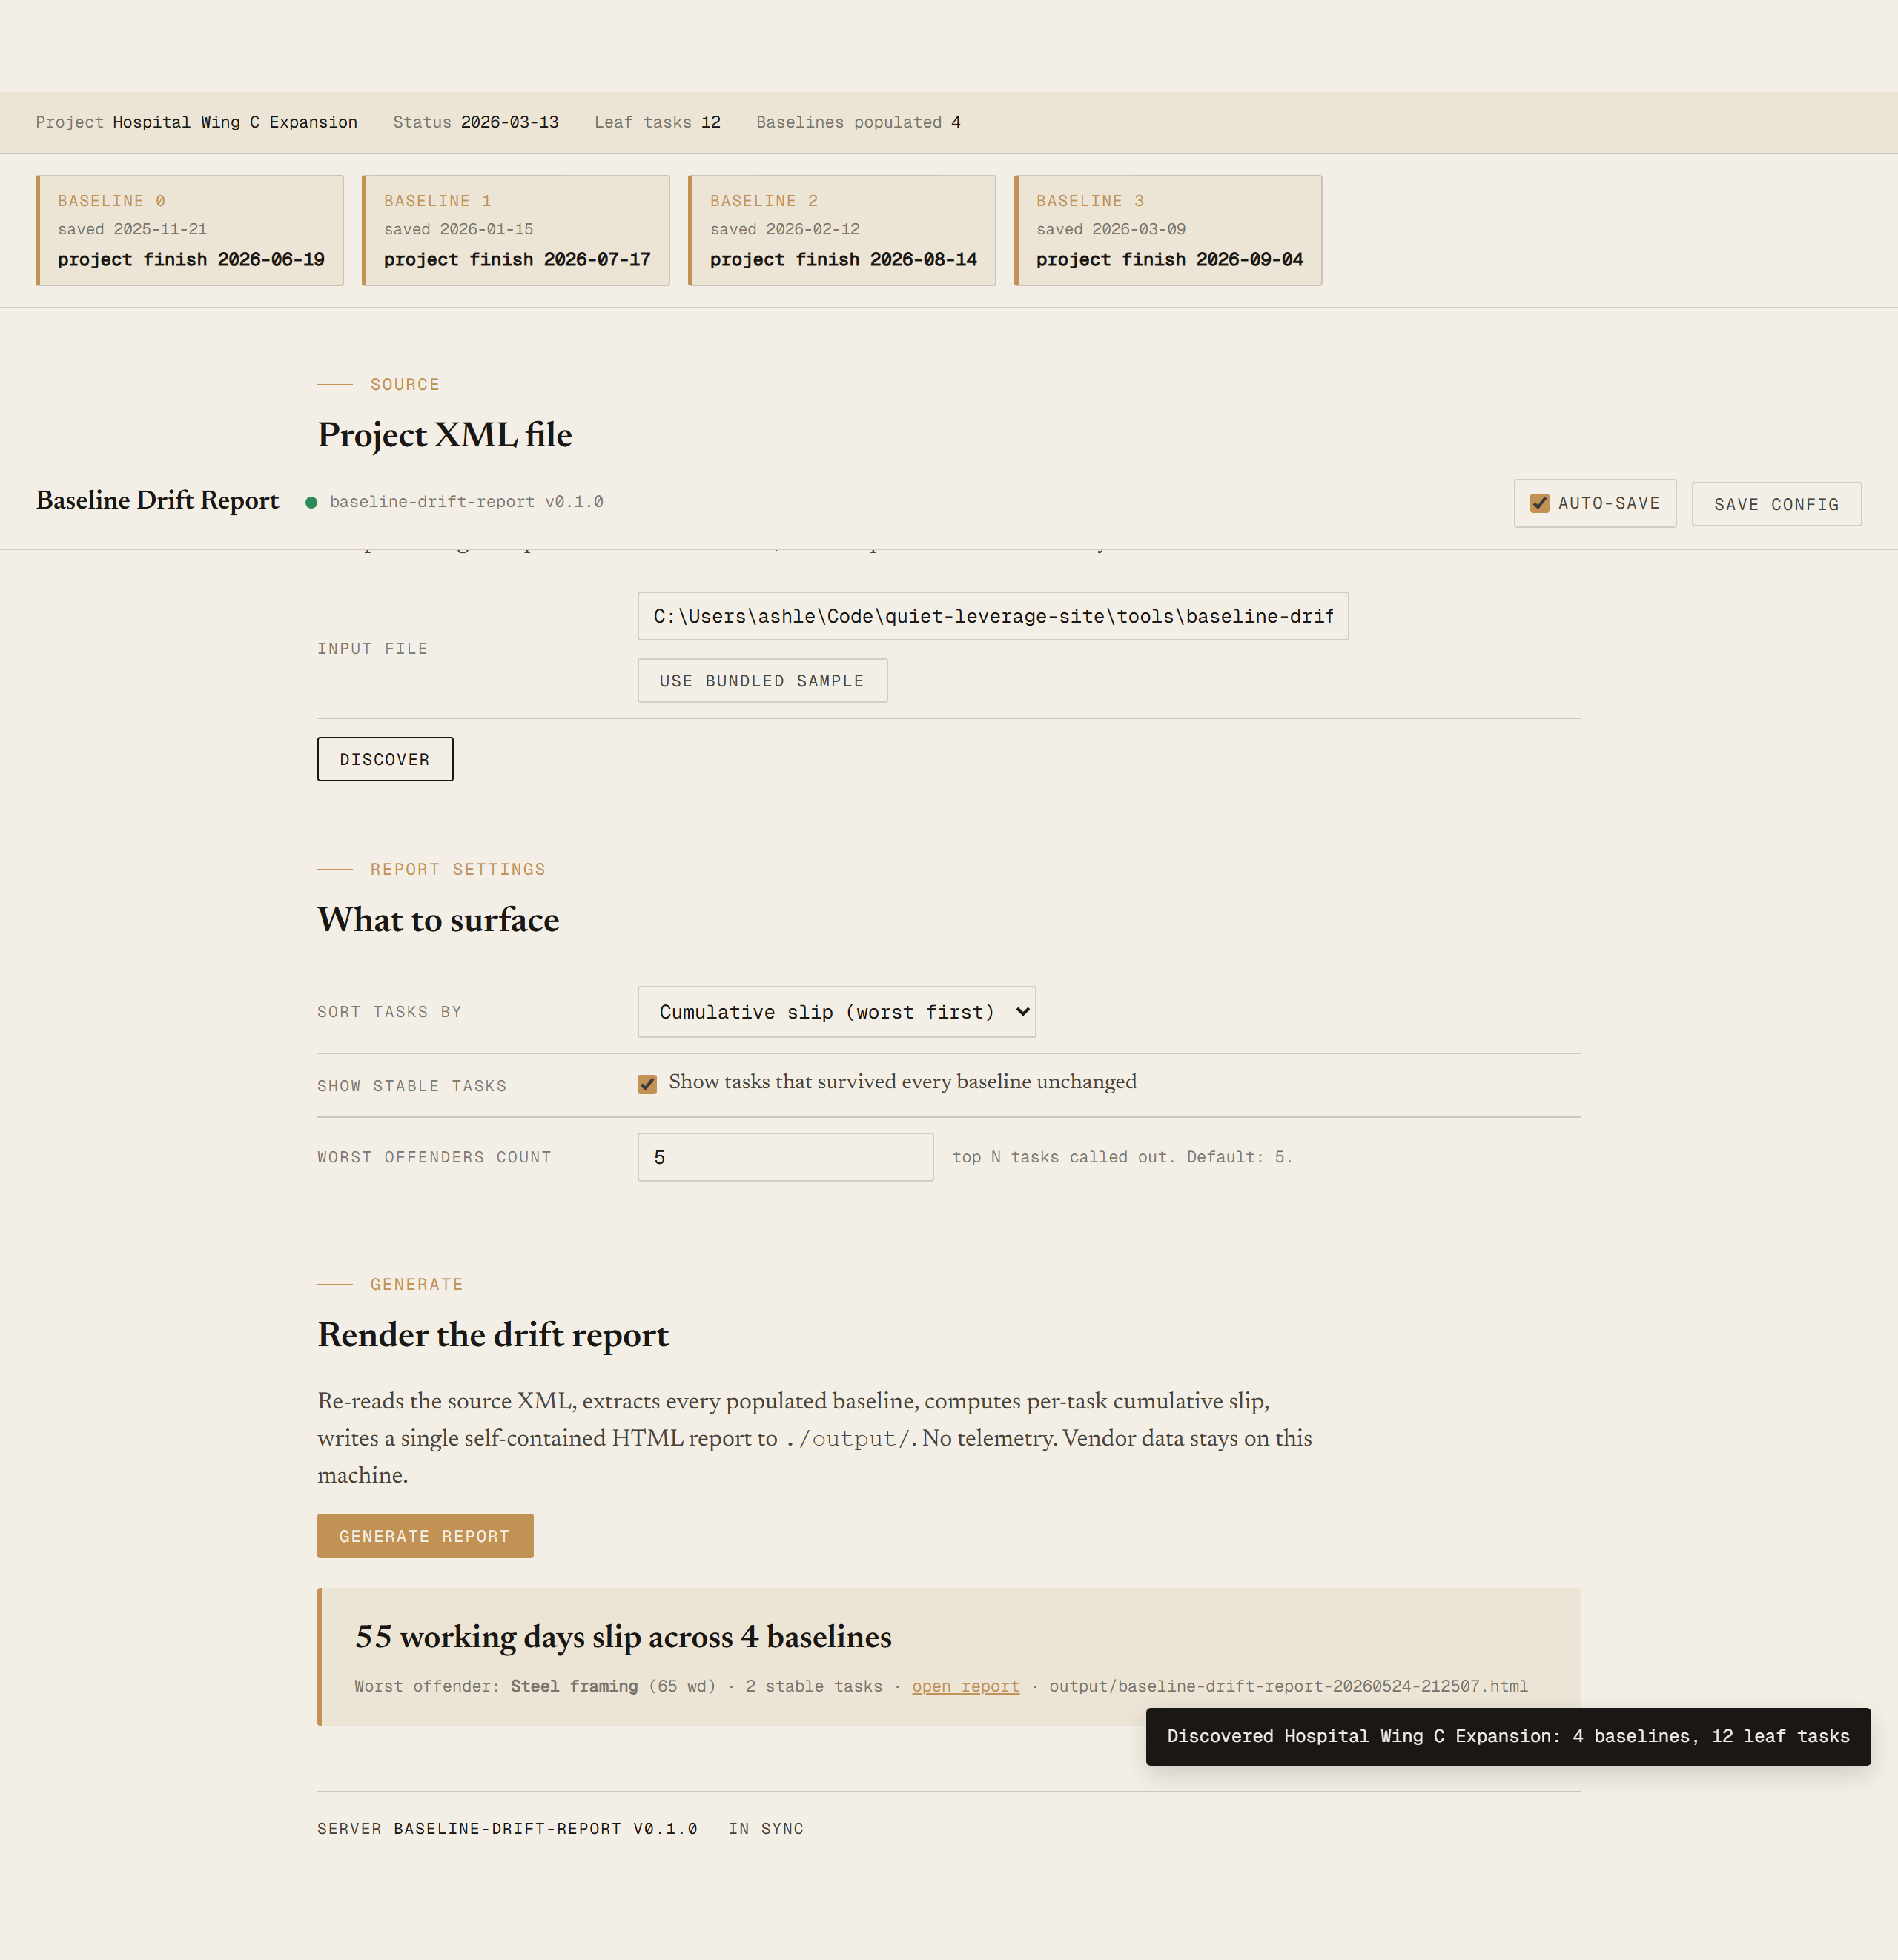
This tool addresses all three: a deterministic local script that extracts every populated baseline from your Project XML, ranks tasks by cumulative slip across re-baselines, and surfaces both the worst offenders and the survivors in one shareable HTML artifact.
One page, every baseline visible, tasks ranked by total drift.
The output is a single self-contained HTML file written to ./output/. System fonts, no external CSS or JS, prints cleanly, embeds in email. Five sections:
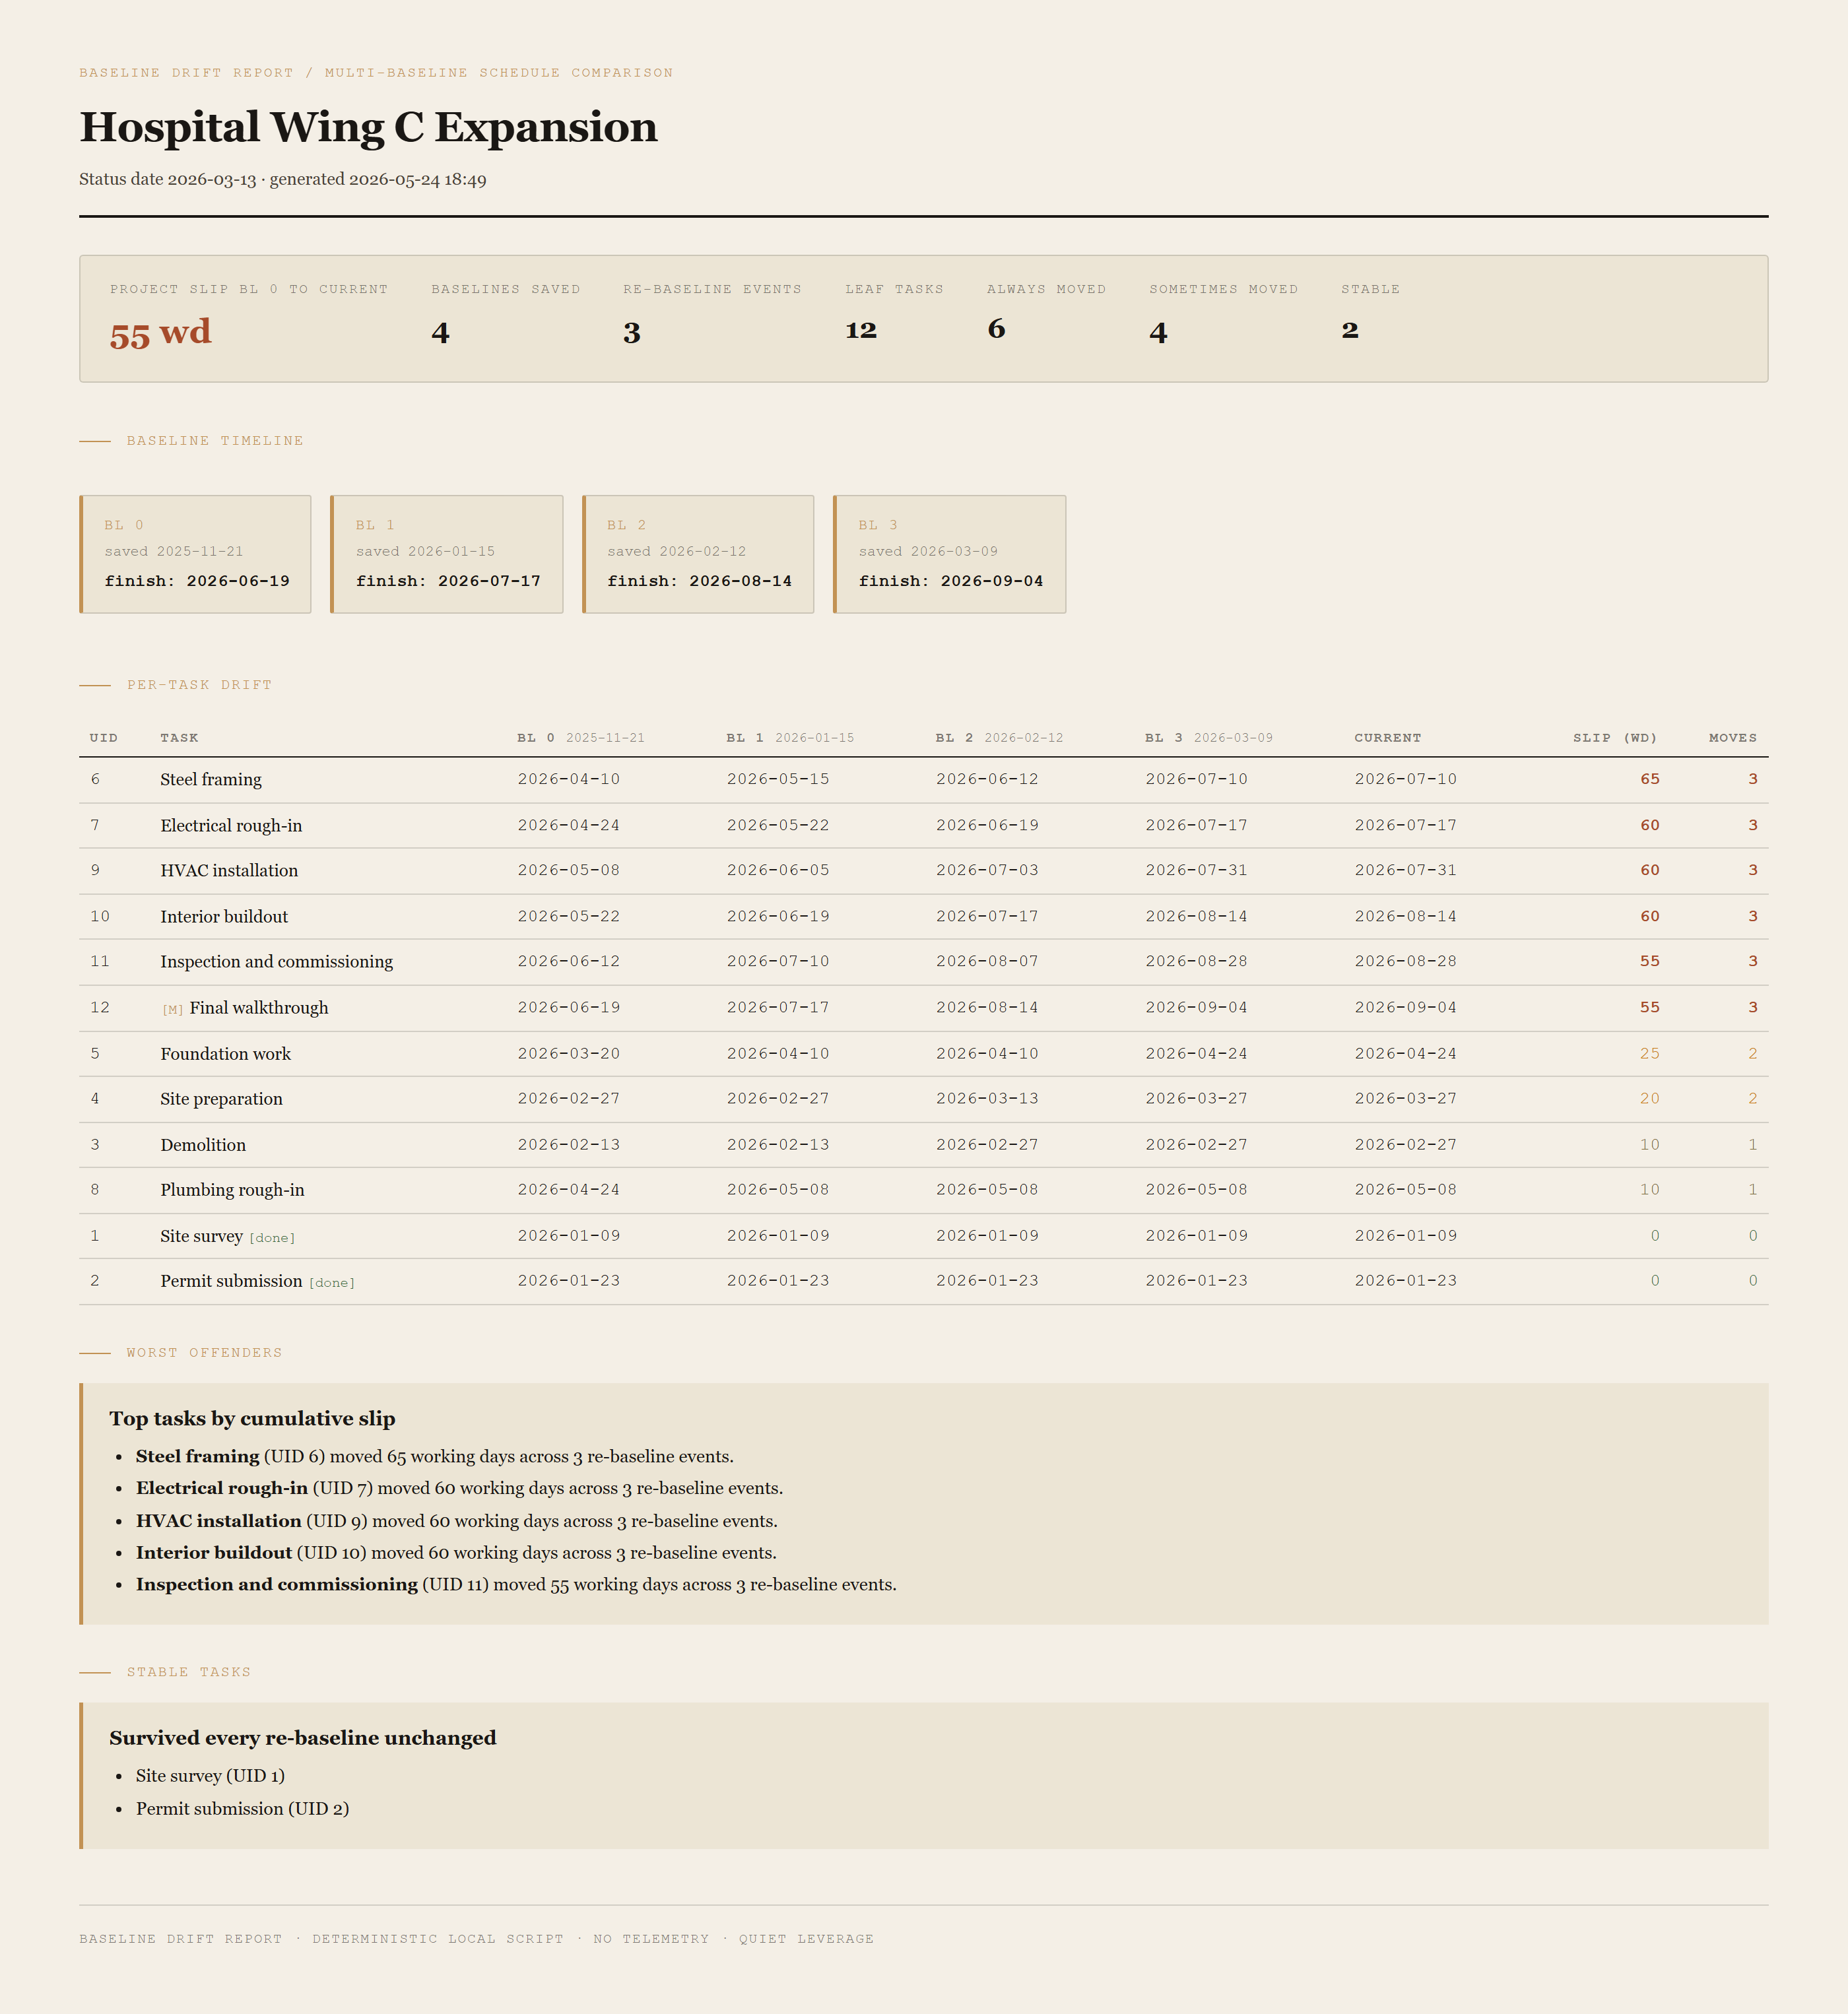
Summary header
Project slip from Baseline 0 to current, baselines saved, re-baseline events, leaf-task count, and a breakdown of always-moved / sometimes-moved / stable tasks. The headline number is total project slip in working days, in ochre.
Baseline timeline
One pill per saved baseline showing the date the baseline was saved (where Project tracked it via the BaselineDate field) and the project finish date that baseline committed to. Reading left-to-right shows the deal history: original commitment, post-change-order, post-delay, current.
Per-task drift table
Every leaf task as a row, every populated baseline's finish date as a column, plus the current forecast finish, the cumulative slip in working days, and the times-moved count. Severe drift is rendered in red; moderate in amber; mild in dim olive; stable in green. Sortable by slip (worst-first) or by ID (chronological).
Worst offenders
Top N tasks by cumulative slip, each as a one-line callout naming the task, the working-day count, and the re-baseline events.
Stable tasks
The credibility signal. Tasks whose finish date is identical across every saved baseline. Listed by UID and name. This is the section the customer reads first.
Requirements
- OSWindows, macOS, or Linux
- RuntimePowerShell 7+ (
pwsh). Windows PowerShell 5.1 is not supported. - BrowserAnything modern. Configuration UI is on
localhost:8772. - MS ProjectRequired only on the PM's machine, to do a one-time File → Save As → XML Format. The reading machine never touches Project.
- NetworkNone. The tool reads a local file and writes a local file.
- DataNever leaves your machine. Schedule data sits on disk; HTML is generated locally; you decide who gets the file.
Claude could write this. Two reasons to prefer the script.
Some workplaces — defense, medical devices, finance, anywhere with a strict IT policy — won't let Claude or any AI tool touch production data. These tools run locally with no network calls. And even where AI is allowed, repeat workflows shouldn't cost tokens — a deterministic script runs the same way every time, for free, forever. The prompt guide below shows how this tool was built with Claude; the download is what you run after.
Three files. Free.
The tool itself, a user guide that walks through the one-time XML export and the Discover/Generate loop, and a prompt guide showing how this was built with Claude Code — including the fixture design that ships with 4 baselines and a 65-working-day worst-offender for a deterministic demo.
Drop your email to unlock the downloads.
One email when new tools ship, digest only. Confirms via Kit (double opt-in). No tracking. Unlocks every download on the site from this browser.
./start.ps1.BaselineFinish AND nested Baseline/Number=0).