Custom Fields Report
Read your Microsoft Project XML, resolve the aliases on your custom fields (Text1 = Vendor, Flag1 = Needs Approval, Number1 = Contract Value), and get a single self-contained HTML page with the full inventory, a per-task table using your alias names, and cross-tab counts by vendor and flag — no Excel pivot, no canned report wrangling, no Project license needed downstream.
Project has 70+ custom fields. No native cross-tab report.
"Tasks by vendor" is not on the Report ribbon.
Microsoft Project's Report ribbon ships a fixed slate of templates — Burndown, Cost Overruns, Late Tasks, Resource Overview, Milestone Report. None of them pivot tasks by Text1 or sum Number1 grouped by Text2. Jigs Gaton (MPUG) puts it plainly:
"When you examine your options on the Report ribbon, you might not see an option that produces the report you had in mind, or you may feel that none of the 'canned' reports... are quite what you were after." Jigs Gaton · MPUG, Demystifying Custom Reports
The PM builds a Group By view, screenshots it, pastes into a deck.
Excel exports your Text1, not your "Vendor."
When the PM finally exports to Excel or CSV, the column headers are Text1, Number1, Flag1. The aliases the team has been using for months — Vendor, Contract Value, Needs Approval — don't make the trip. The downstream consumer (the contracts office, the auditor, the steering committee) has no idea what those columns mean.
The aliases are project-local. The reports want to be portfolio.
A program manager with 6 active schedules can't run "all tasks flagged Needs Approval across the portfolio" in Project. The aliases are stored per-project; cross-project reporting requires exporting each schedule, normalizing column names, and stitching in Excel. This tool runs against one schedule at a time, but the HTML output is portable — concatenate by hand or by pipeline.
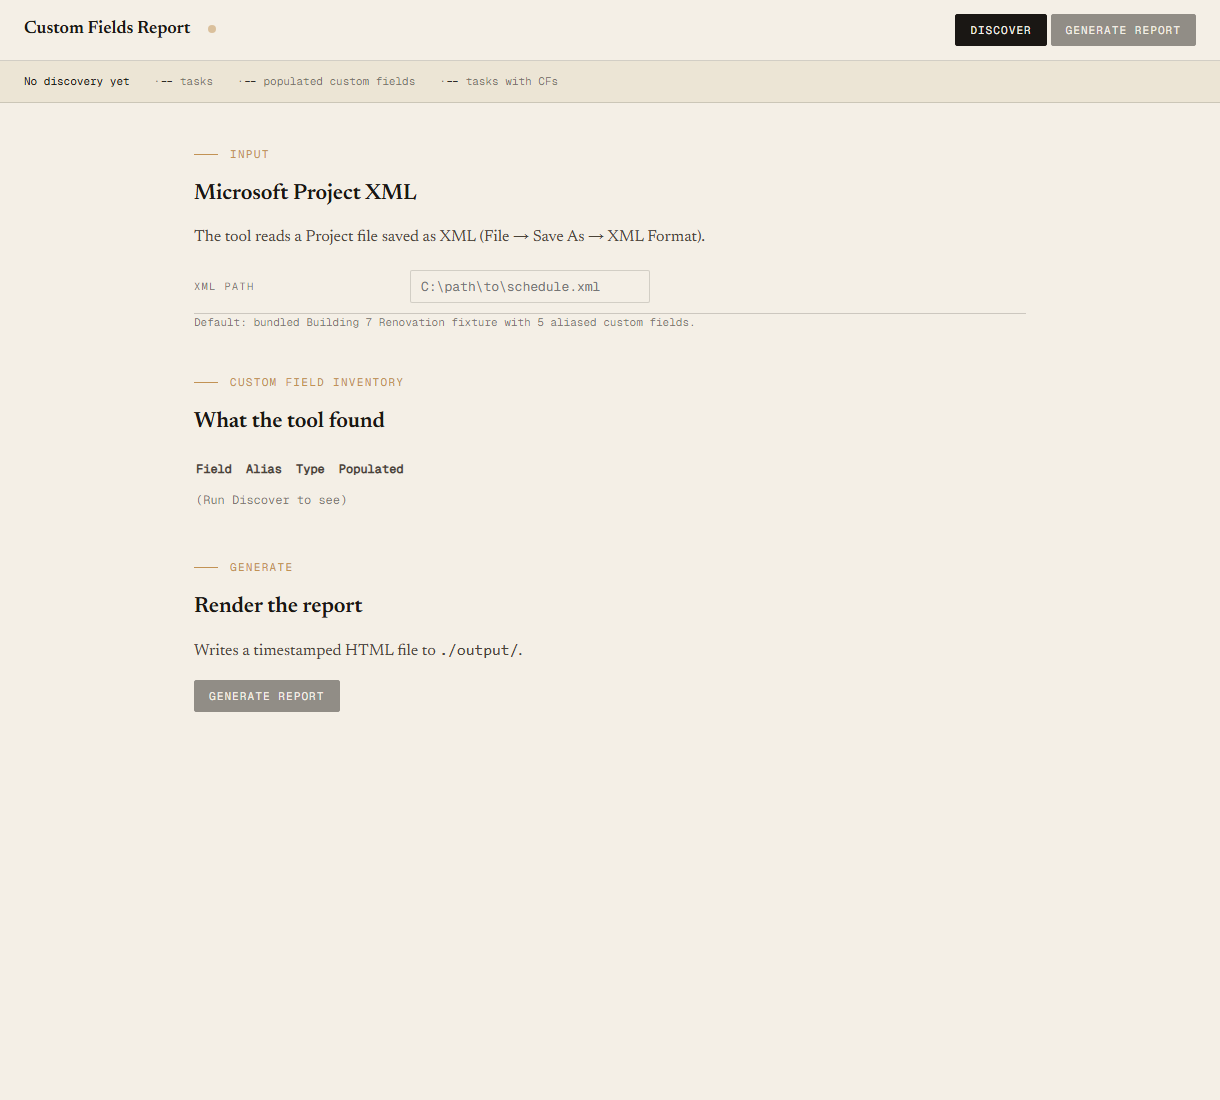
This tool addresses the first two directly and gives the foundation for the third: a deterministic local script that reads the Project XML, resolves the aliases via the ExtendedAttributes definitions, and produces a single self-contained HTML artifact with the inventory, the per-task table, and the cross-tab counts.
One page, three sections, aliased columns throughout.
The output is a single self-contained HTML file written to ./output/. System fonts, no external CSS or JS, prints cleanly, embeds in email.
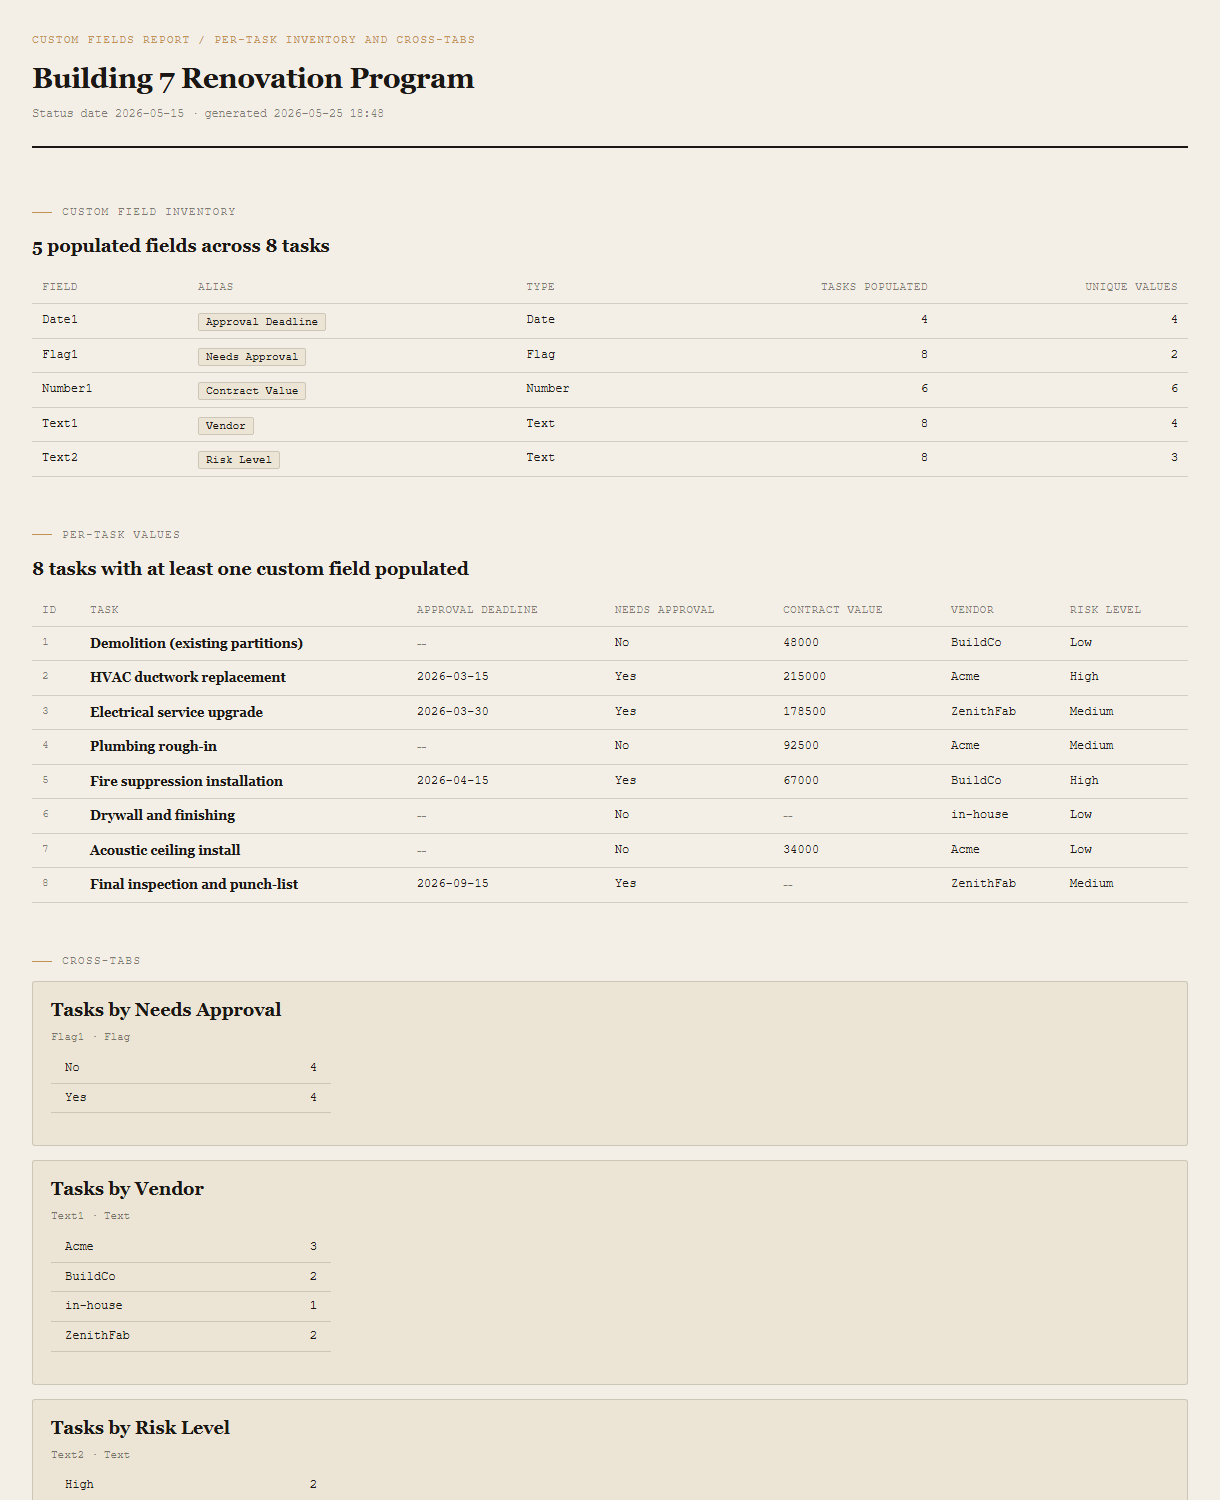
Inventory
One row per populated custom field. Columns: field name (Text1, Number1), alias (Vendor, Contract Value), type (Text / Number / Date / Flag), tasks populated count, unique values count. Fields not used in the schedule are excluded — a clean inventory of what's actually in play.
Per-task table
One row per task with at least one populated custom field. Column headers are the alias if set, otherwise the raw FieldName. Empty cells render as a faint dash. Flag fields show Yes/No, Date fields show yyyy-MM-dd, Number/Text pass through.
Cross-tabs
For each Text field with ≤ 20 unique values, a value-count breakdown ("Tasks by Vendor: Acme = 3, BuildCo = 2, ZenithFab = 2, in-house = 1"). For each Flag field, Yes/No counts. The cross-tab the PM was about to build by hand in Excel, generated.
Requirements
- OSWindows, macOS, or Linux
- RuntimePowerShell 7+ (
pwsh). Windows PowerShell 5.1 is not supported. - BrowserAnything modern. Configuration UI is on
localhost:8775. - MS ProjectRequired only on the PM's machine, to do a one-time File → Save As → XML Format.
- NetworkNone. Local file in, local file out.
- DataNever leaves your machine.
Claude could write this. Two reasons to prefer the script.
Some workplaces — defense, medical devices, finance, anywhere with a strict IT policy — won't let Claude or any AI tool touch production data. These tools run locally with no network calls. And even where AI is allowed, repeat workflows shouldn't cost tokens — a deterministic script runs the same way every time, for free, forever. The prompt guide below shows how this tool was built with Claude; the download is what you run after.
Three files. Free.
The tool itself, a user guide that walks through the XML export and the discover/generate loop, and a prompt guide showing how this was built with Claude Code — the spec, the seeded fixture, the Pester contract that pins every cross-tab count.
Drop your email to unlock the downloads.
One email when new tools ship, digest only. Confirms via Kit (double opt-in). No tracking. Unlocks every download on the site from this browser.
./start.ps1.