Resource Allocation Heatmap
Project's Resource Usage view tells you who is overallocated, but it tells you one resource at a time, on a timescale grid you have to scroll horizontally to read. This tool produces a one-page heatmap — every resource as a row, every week as a column, every overallocated cell shaded amber or red — that a staffing lead can read in a glance.
Resource overallocation is real-time data with no shareable view.
Resource Usage is a grid. Resource Graph is one resource at a time.
Project surfaces resource loading three ways: the Resource Usage view (timescale grid, one row per assignment, scroll horizontally to find red cells), the Resource Graph (bar chart, one resource at a time), and the Team Planner (Project Professional only). None of them roll up to a single page that names "here are the 3 resources who are overallocated, here's the worst week for each." The PM looks at the grid, picks the worst resource, screenshots it, pastes it into Slack.
"The problem lies in that with these views, you really won't know which resources are free and if they can be employed in critical activities." MPUG · Understanding and Using Resource Graph View in MS Project
110% and 220% look the same in Project's view.
Project's overallocation indicator is binary — a resource is either over capacity or not. A staffing decision needs the magnitude. Sarah at 110% next week is "shift one task to Tuesday." Sarah at 220% is "Sarah cannot do this, hire a contractor." The PM has to drill into the cell value to see which it is, for every flagged resource, every week.
"Who has bandwidth?" gets answered the same way overallocation does.
When a new task comes in mid-project, the staffing lead asks "who has bandwidth in week of June 8?" Project doesn't show resource slack as positive headline data; it shows it as the absence of red. The PM eyeballs the grid for empty cells. This tool renders the under-utilized cells in green so headcount slack is the corollary of overallocation, visible in the same glance.
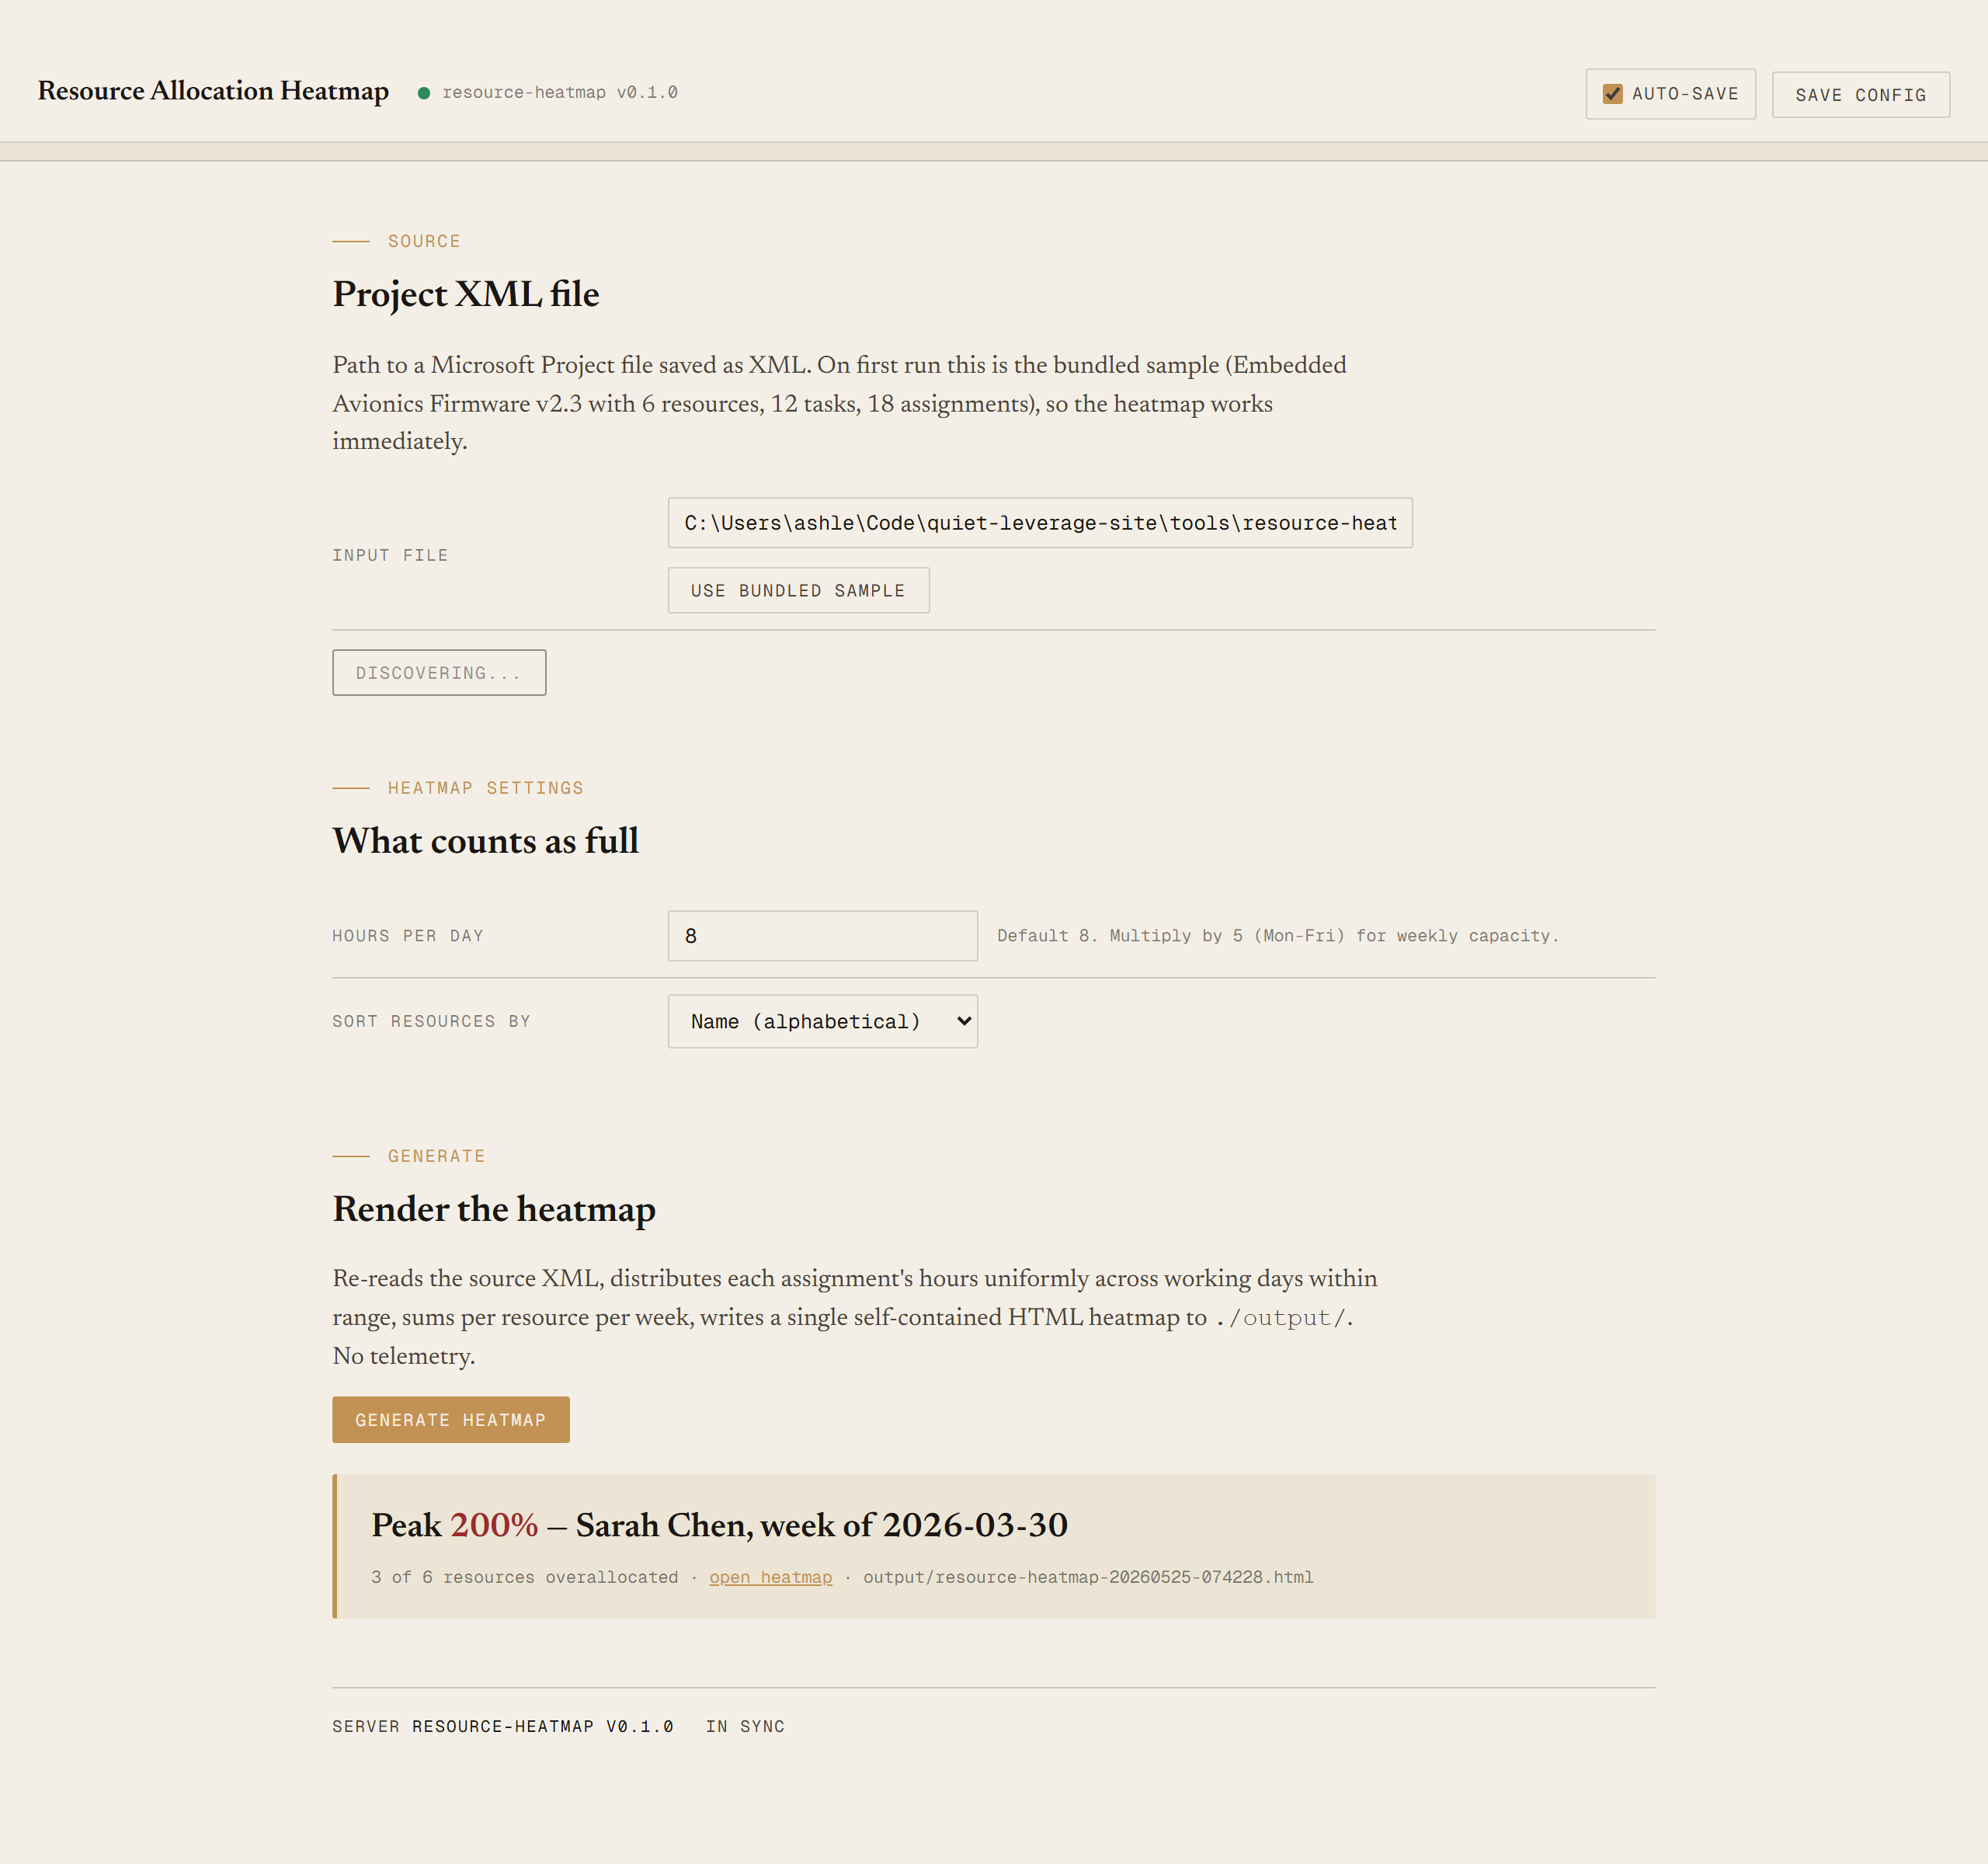
This tool addresses all three: a deterministic local script that distributes assignment hours across working days, sums per resource per week, and produces an HTML heatmap with magnitude-aware shading plus a summary table that names every overallocated resource, peak %, and worst week.
One page, every resource, every week, magnitude visible.
The output is a single self-contained HTML file written to ./output/. System fonts, no external CSS or JS, prints cleanly, embeds in email.
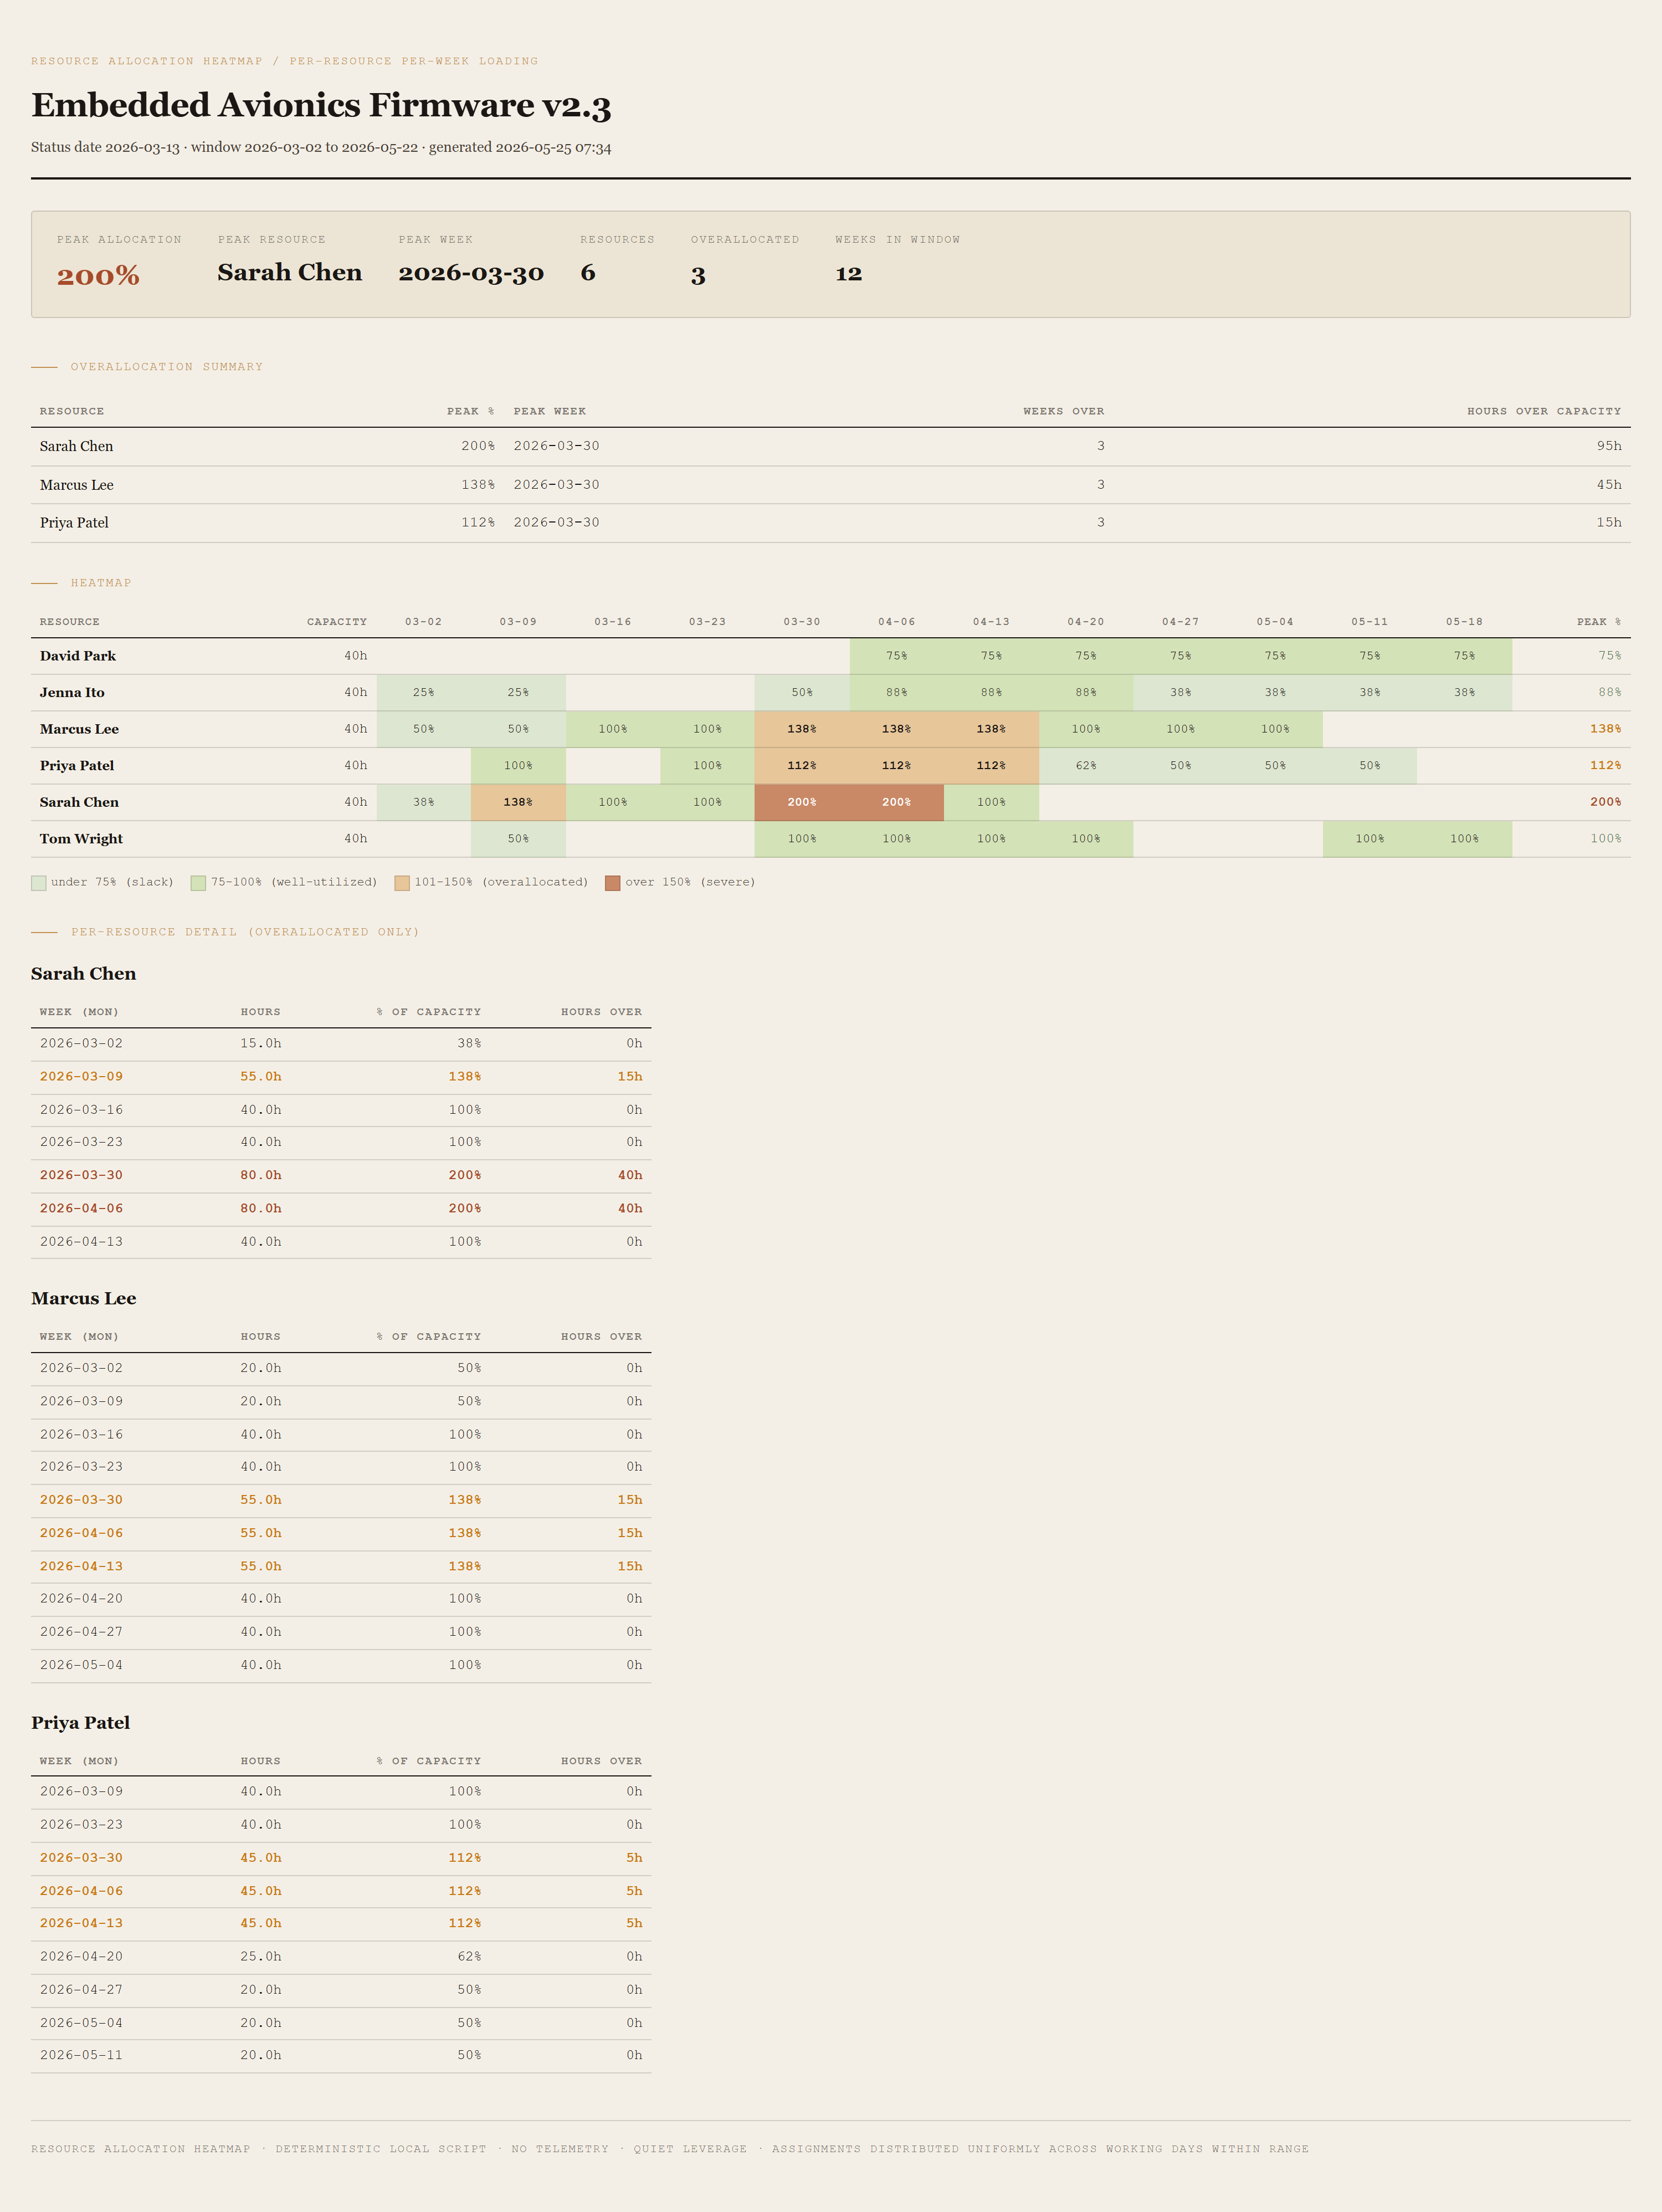
Summary header
Peak allocation %, peak resource name, peak week (date of the Monday), total resources, overallocated count, weeks in the heatmap window. The peak number is in red ochre so the headline lands first.
Overallocation summary table
One row per overallocated resource: name, peak %, peak week, weeks over capacity, total hours over capacity across the window. Sorted worst-first. This is the table the staffing lead reads.
Heatmap grid
Rows = resources, columns = weeks. Each cell shows allocation % and is shaded by severity: dim green (under 75% — slack), pale (75-100% — well-utilized), amber (101-150% — overallocated), red (over 150% — severe). Underutilized cells are intentionally green-positive: visible headcount slack is the corollary of visible overallocation.
Per-resource detail
For each overallocated resource: a small table showing every week with non-zero hours, with hours, % of capacity, and hours over capacity. Useful when the staffing lead asks "Sarah is at 200% in week of March 30 — which tasks specifically?"
Requirements
- OSWindows, macOS, or Linux
- RuntimePowerShell 7+ (
pwsh). Windows PowerShell 5.1 is not supported. - BrowserAnything modern. Configuration UI is on
localhost:8773. - MS ProjectRequired only on the PM's machine for the one-time File → Save As → XML Format.
- NetworkNone. Local file in, local file out.
- DataNever leaves your machine.
Claude could write this. Two reasons to prefer the script.
Some workplaces — defense, medical devices, finance, anywhere with a strict IT policy — won't let Claude or any AI tool touch production data. These tools run locally with no network calls. And even where AI is allowed, repeat workflows shouldn't cost tokens — a deterministic script runs the same way every time, for free, forever. The prompt guide below shows how this tool was built with Claude; the download is what you run after.
Three files. Free.
The tool, a user guide that walks through the XML export and the resource-loading math, and a prompt guide showing how the synthetic fixture was designed to land each resource on a specific peak (200% / 137.5% / 112.5% / 100% / 87.5% / 75%) without overlapping assignments breaking the numbers.
Drop your email to unlock the downloads.
One email when new tools ship, digest only. Confirms via Kit (double opt-in). No tracking. Unlocks every download on the site from this browser.
./start.ps1.